Sociodemographic Characteristics of Fathers by Fathers’ Coresidential Status
Family Profile No. 20, 2023
Author: Katherine Graham
Fathers do not always reside with their biological or adopted children. Previous research has found that 78% of fathers have only coresidential children, 12% of fathers have only non-coresidential children, and 10% of fathers have both non- and coresidential children (FP-22-22 & Child Trends, 2023). This profile is an extension of FP-22-22. We use a pooled sample of the 2015-2017 and 2017-2019 cycles of the National Survey of Family Growth to examine differences in union status, education level, race/ethnicity, and median age by fathers’ coresidential status. We consider fathers with only coresidential, only non-coresidential, and both non- and coresidential biological or adopted children.
Union Status
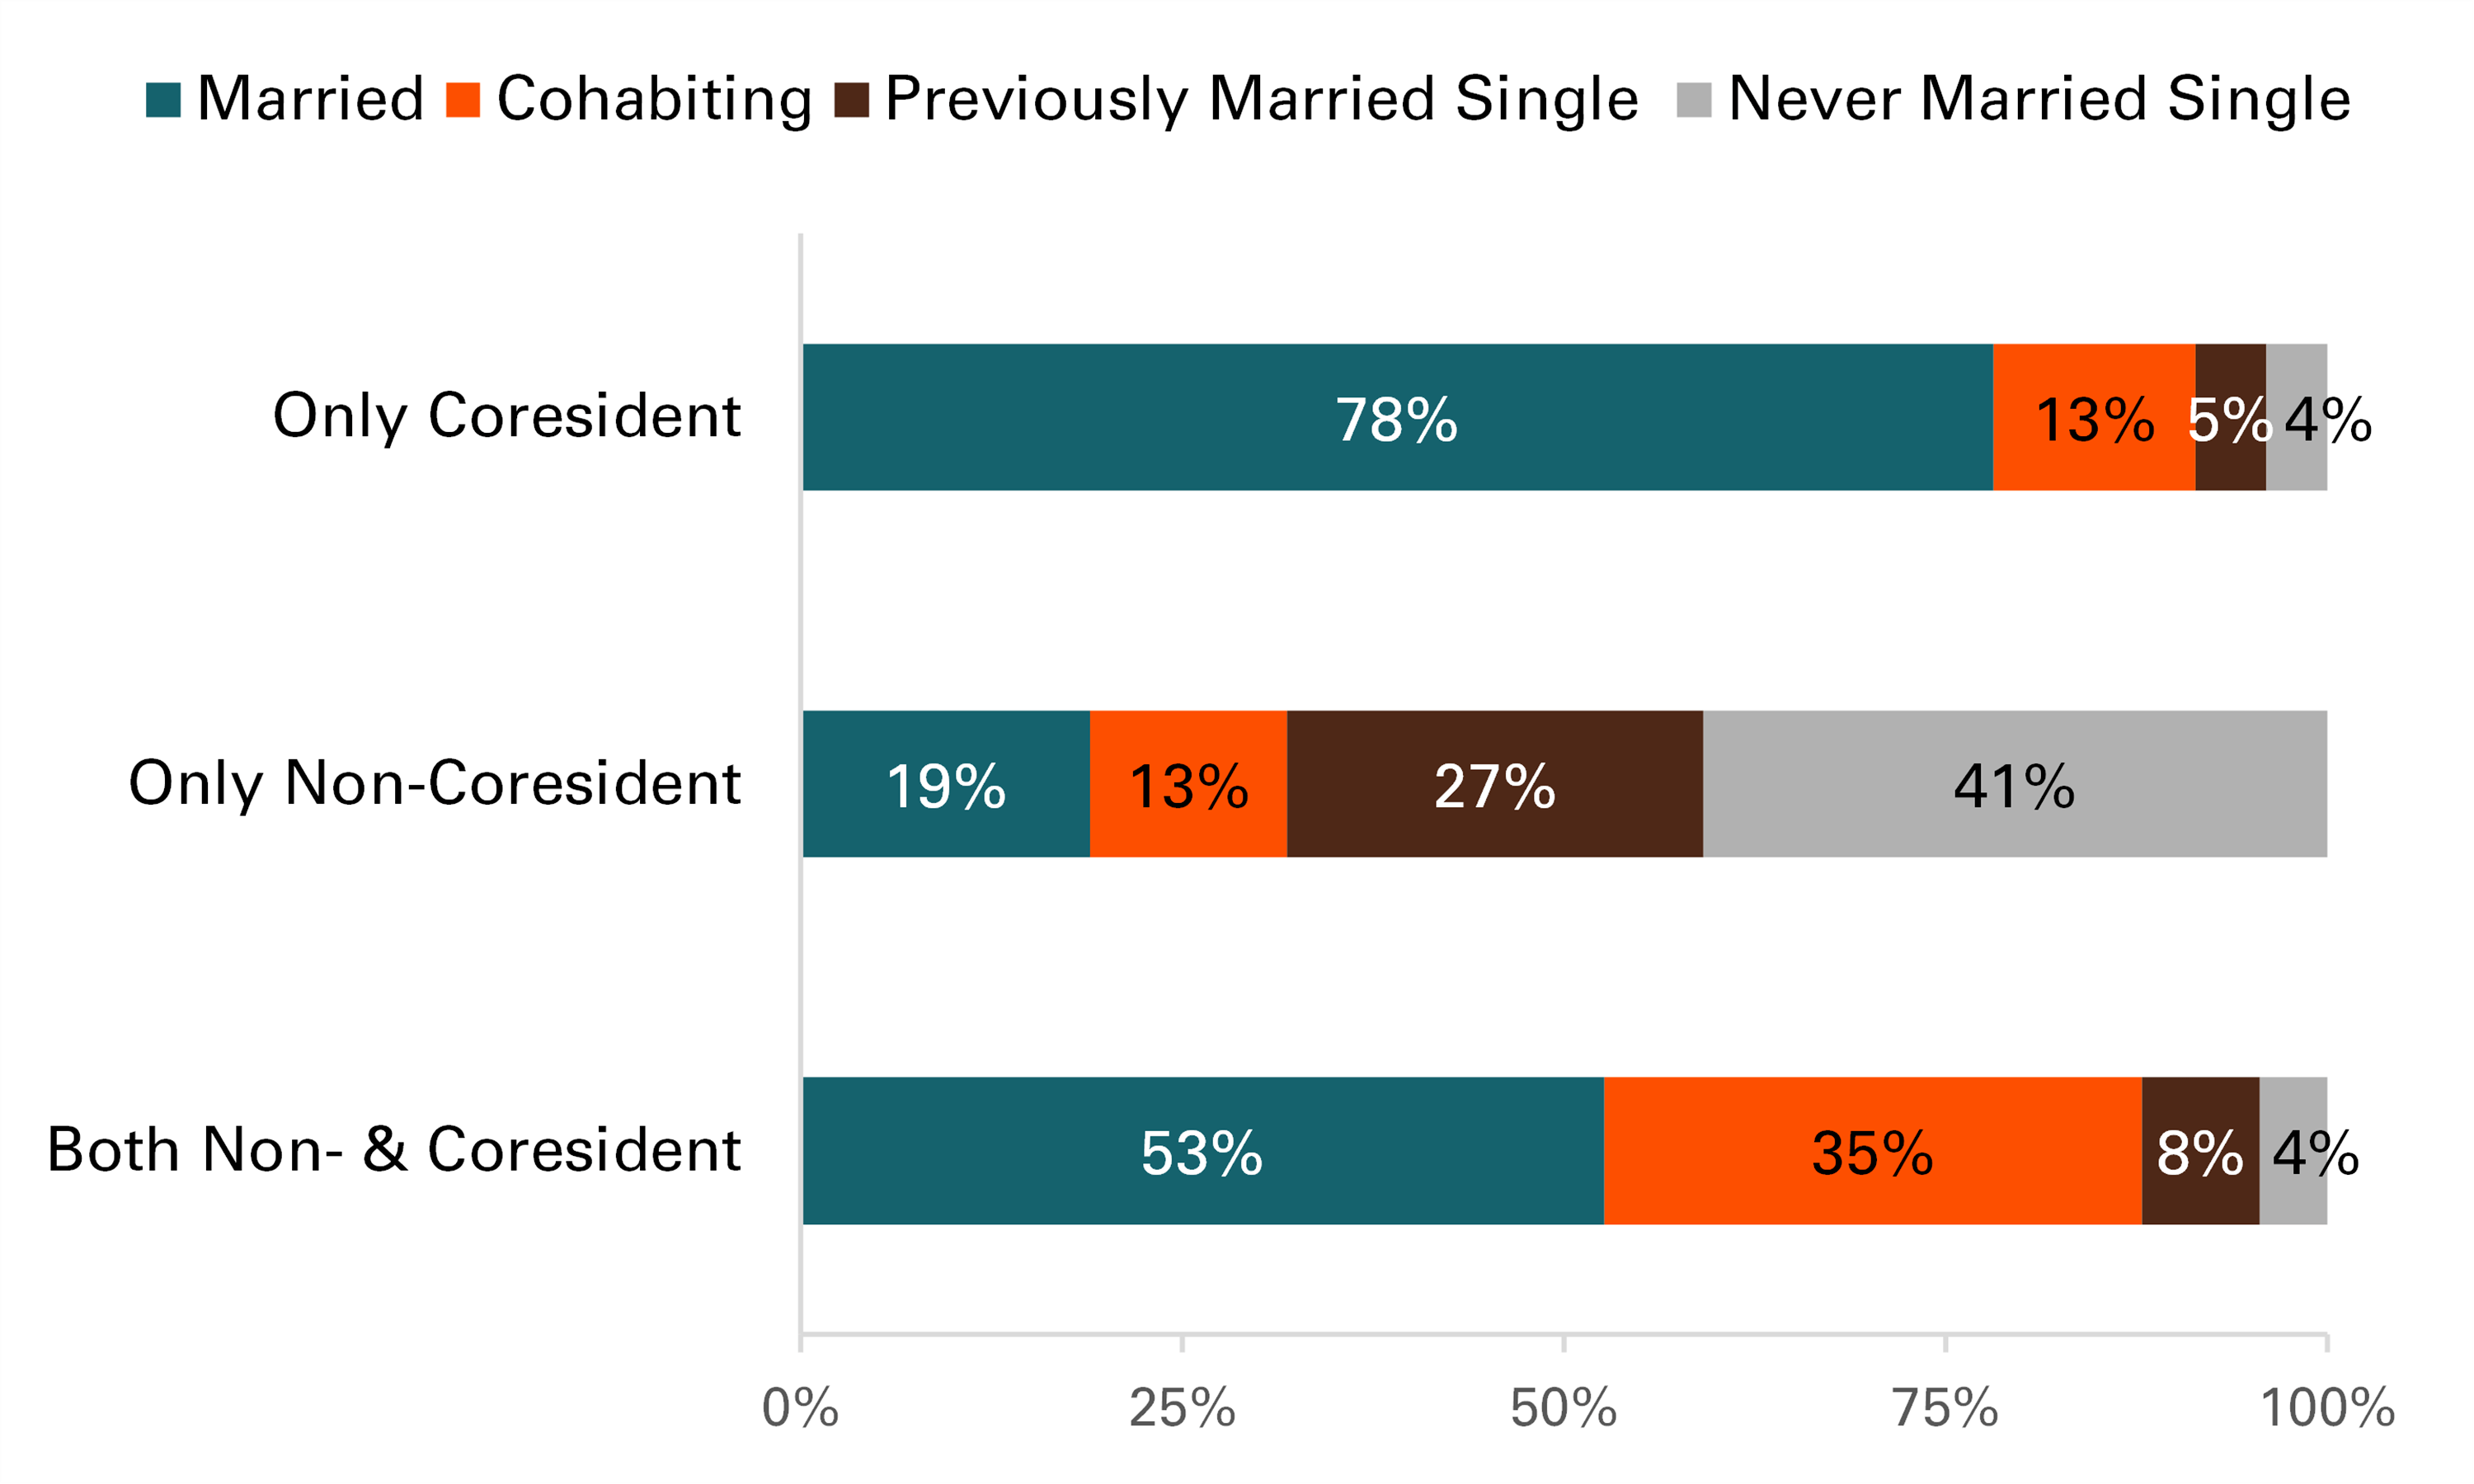
- Among fathers with only coresidential children, almost all were in coresidential relationships (91%). Over three-fourths were married (78%) and 13% were cohabiting. Fewer than one in ten (9%) fathers with only coresidential children were single with 5% previously married single and 4% never married single.
- Among fathers with only non-coresidential children, a majority were single with 27% previously married single and 41% never married single. Less than one-third of fathers with only non-coresidential children were in marital or cohabiting relationships (19% and 13%, respectively).
- Over half of fathers with both non- and coresidential children were married (53%) and over one-third were cohabiting (35%). Like fathers with only coresidential children, about one in ten fathers with both non- and coresidential children were previously married single or never married single (8% and 4%, respectively).
Figure 1. Union Status by Fathers’ Coresidence Status

Education Level
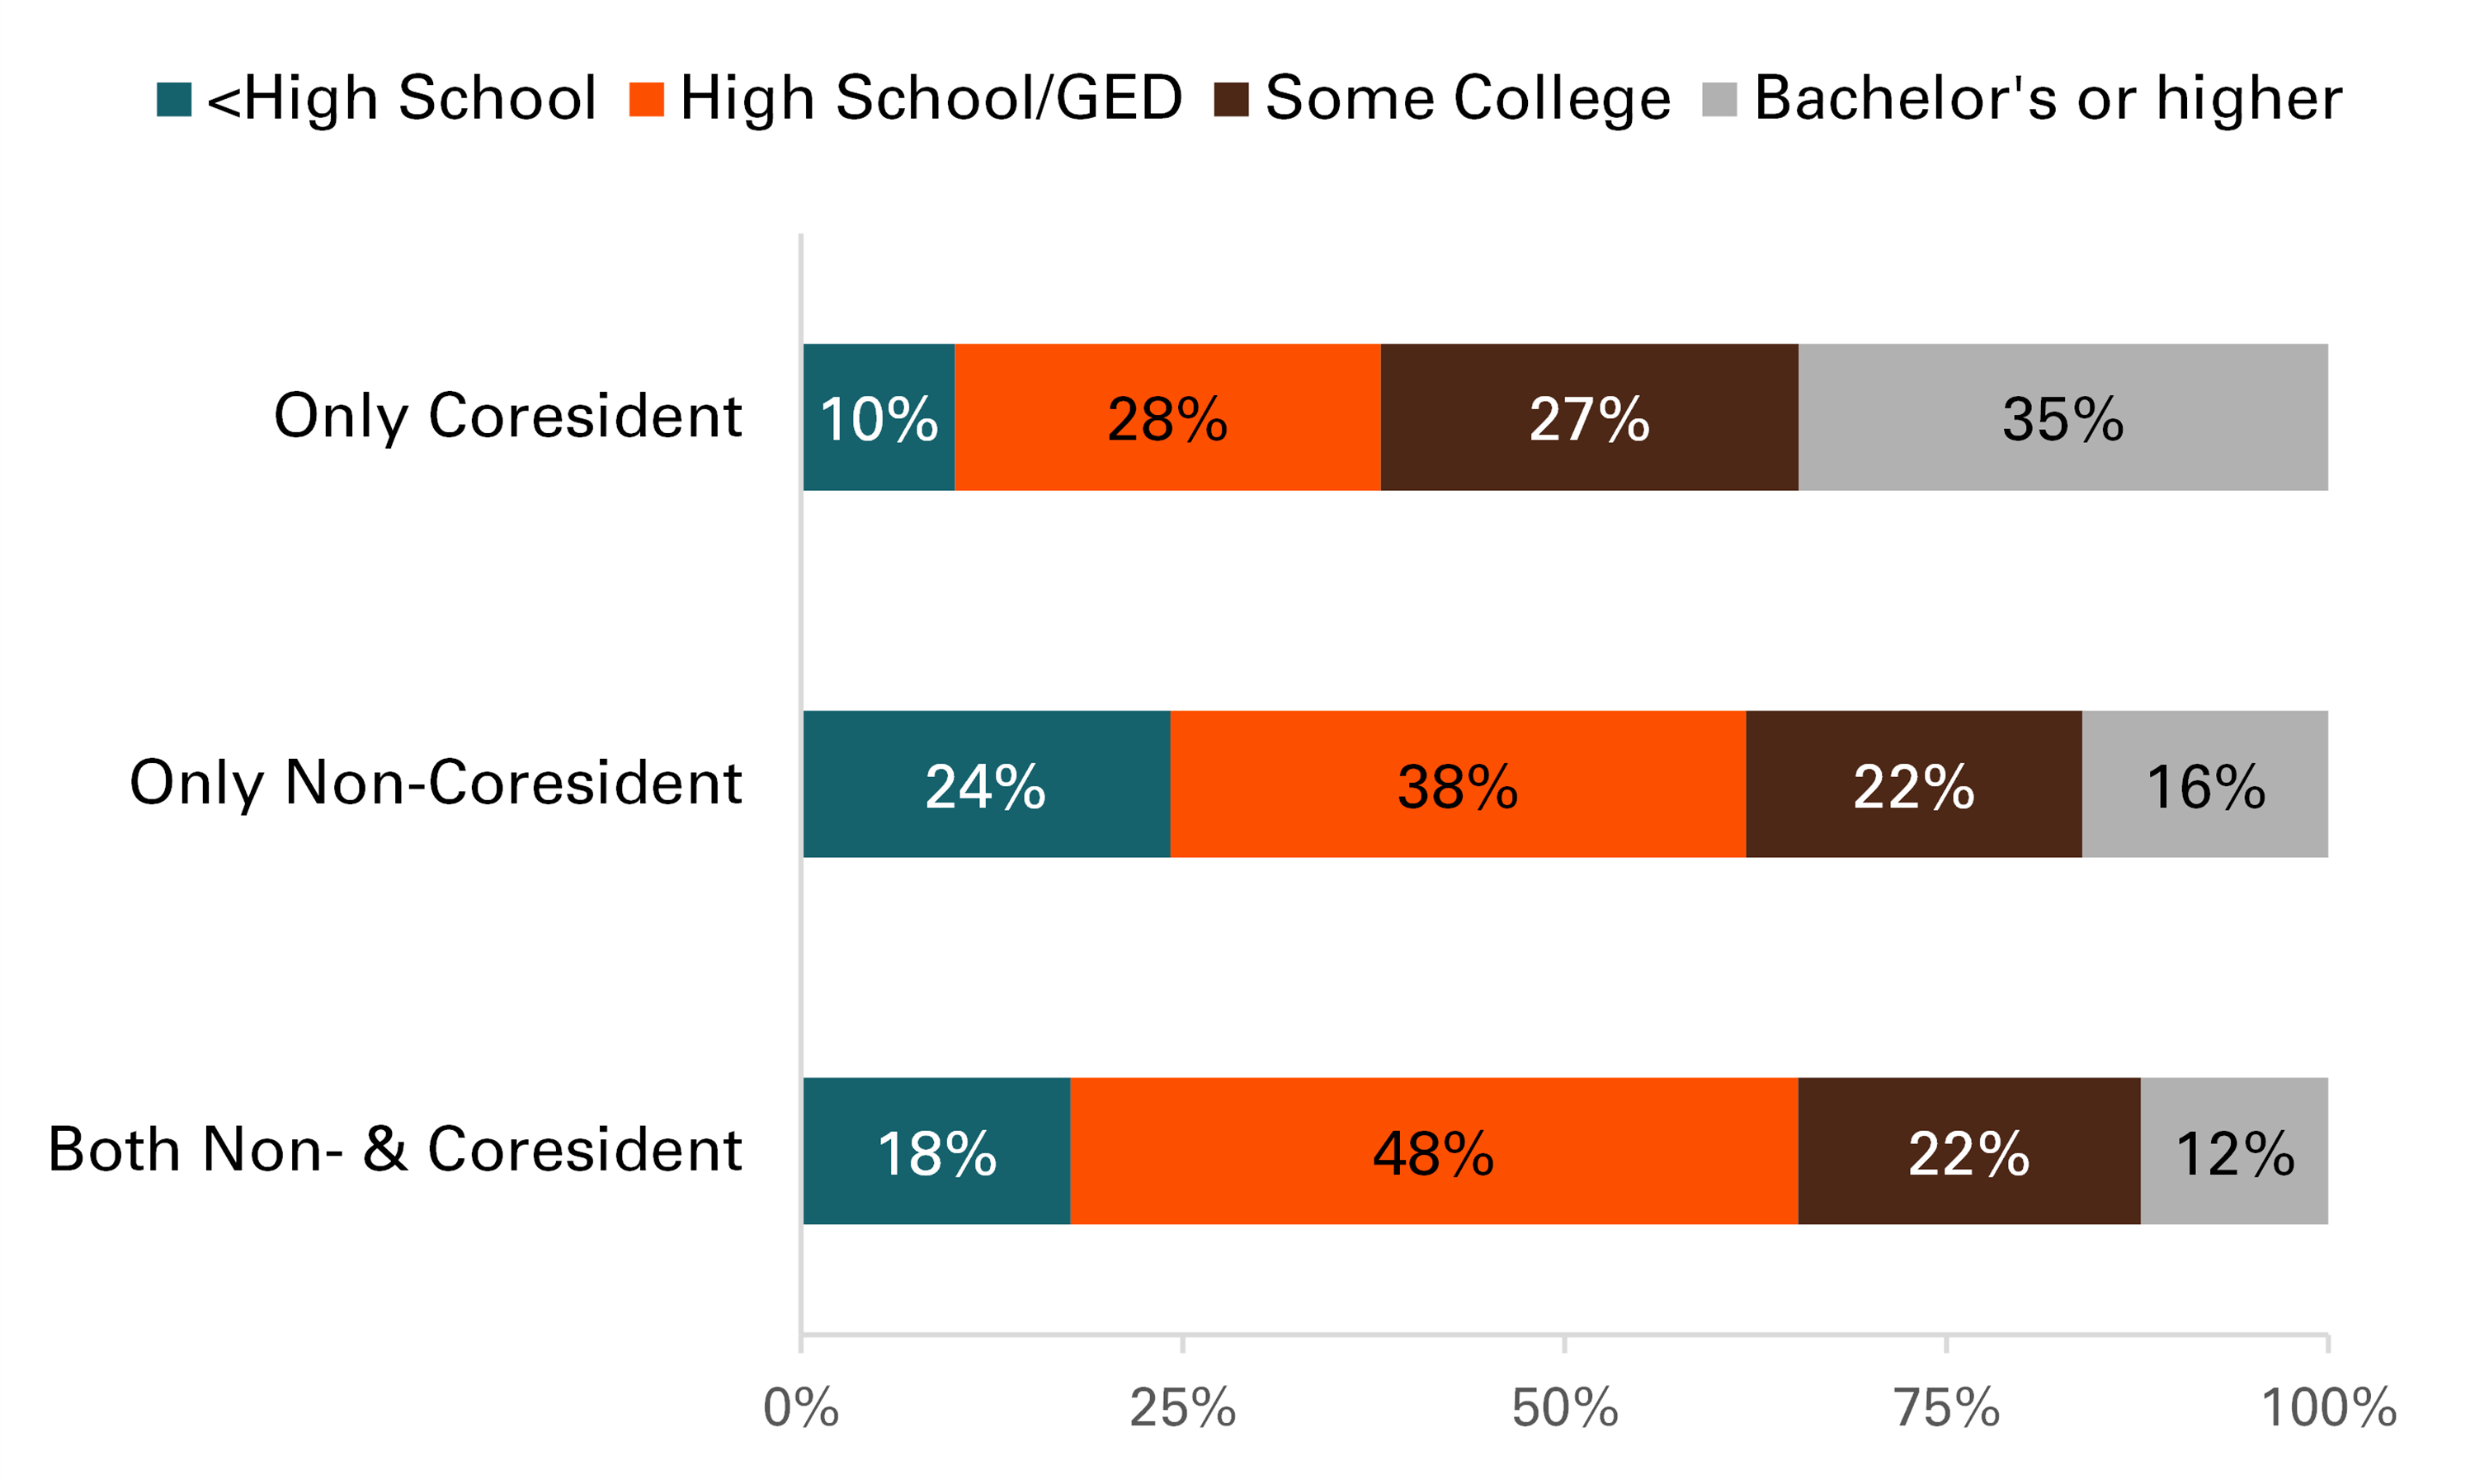
- Fathers with only coresidential children had the highest level of educational attainment. About one-third had a bachelor’s degree or higher (35%) and 27% had some college education. Nearly three in ten (28%) fathers with only coresidential children had a high school diploma and one in ten (10%) had less than a high school-level education.
- Fathers with only non-coresidential children had the lowest levels of education: 16% had a bachelor’s degree or higher and 22% had some college education. Over half had a high school education or less. A quarter had less than a high school education (24%) and over one third had a high school education (38%).
- For fathers with both non- and coresidential children, 12% had a college degree or higher, 22% had some college education, almost half had a high school education (48%), and 18% had less than a high school education.
Figure 2. Education Level by Fathers’ Coresidence Status

Race/Ethnicity
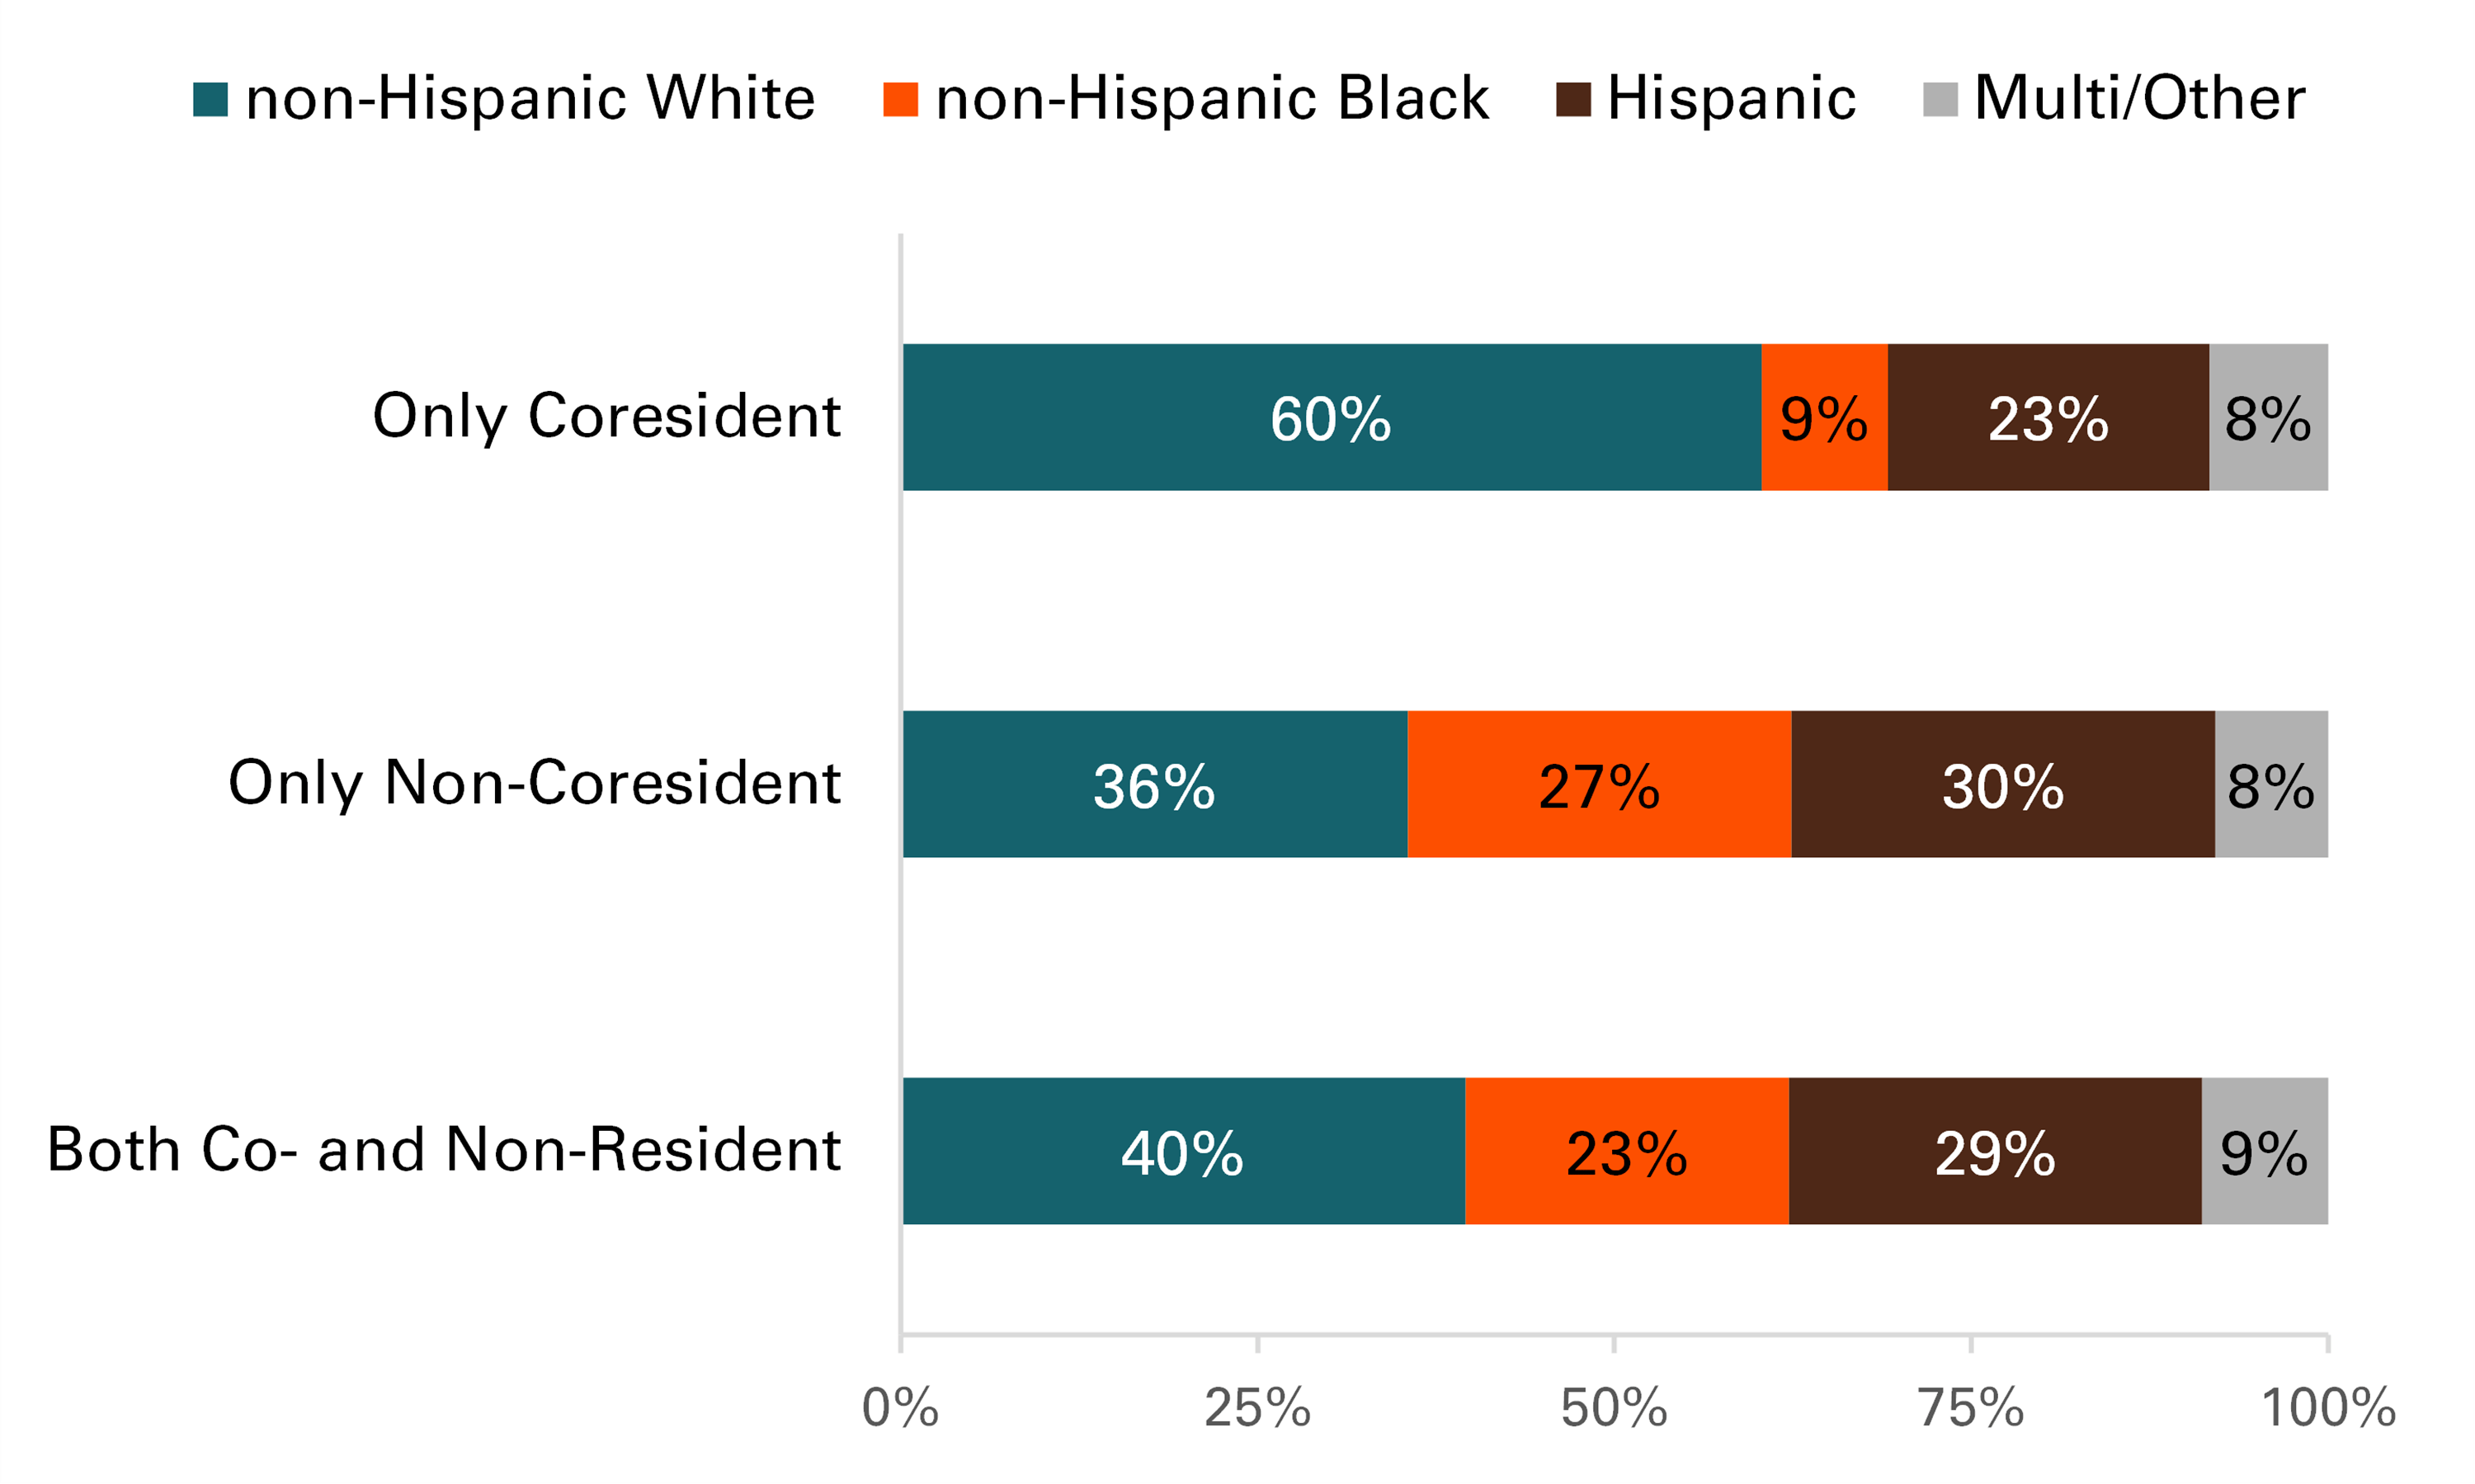
- A majority of only coresidential fathers were non-Hispanic White (60.3%), 8.9% were non-Hispanic Black, 22.5% were Hispanic, and 8.3% were multi-racial or another race/ethnicity.
- Over one-third of non-coresidential fathers were non-Hispanic White (35.6%), about a quarter were non-Hispanic Black (26.8%). Three in ten non-coresidential fathers were Hispanic and 7.9% were multi-racial or another race/ethnicity.
- Among fathers with both non- and coresidential children, about 39.6% were non-Hispanic White, 22.7% were non-Hispanic Black, 28.9% were Hispanic and 8.8% were multi-racial or another race/ethnicity.
Figure 3. Race/ethnicity by Fathers’ Coresidence Status

Median Age
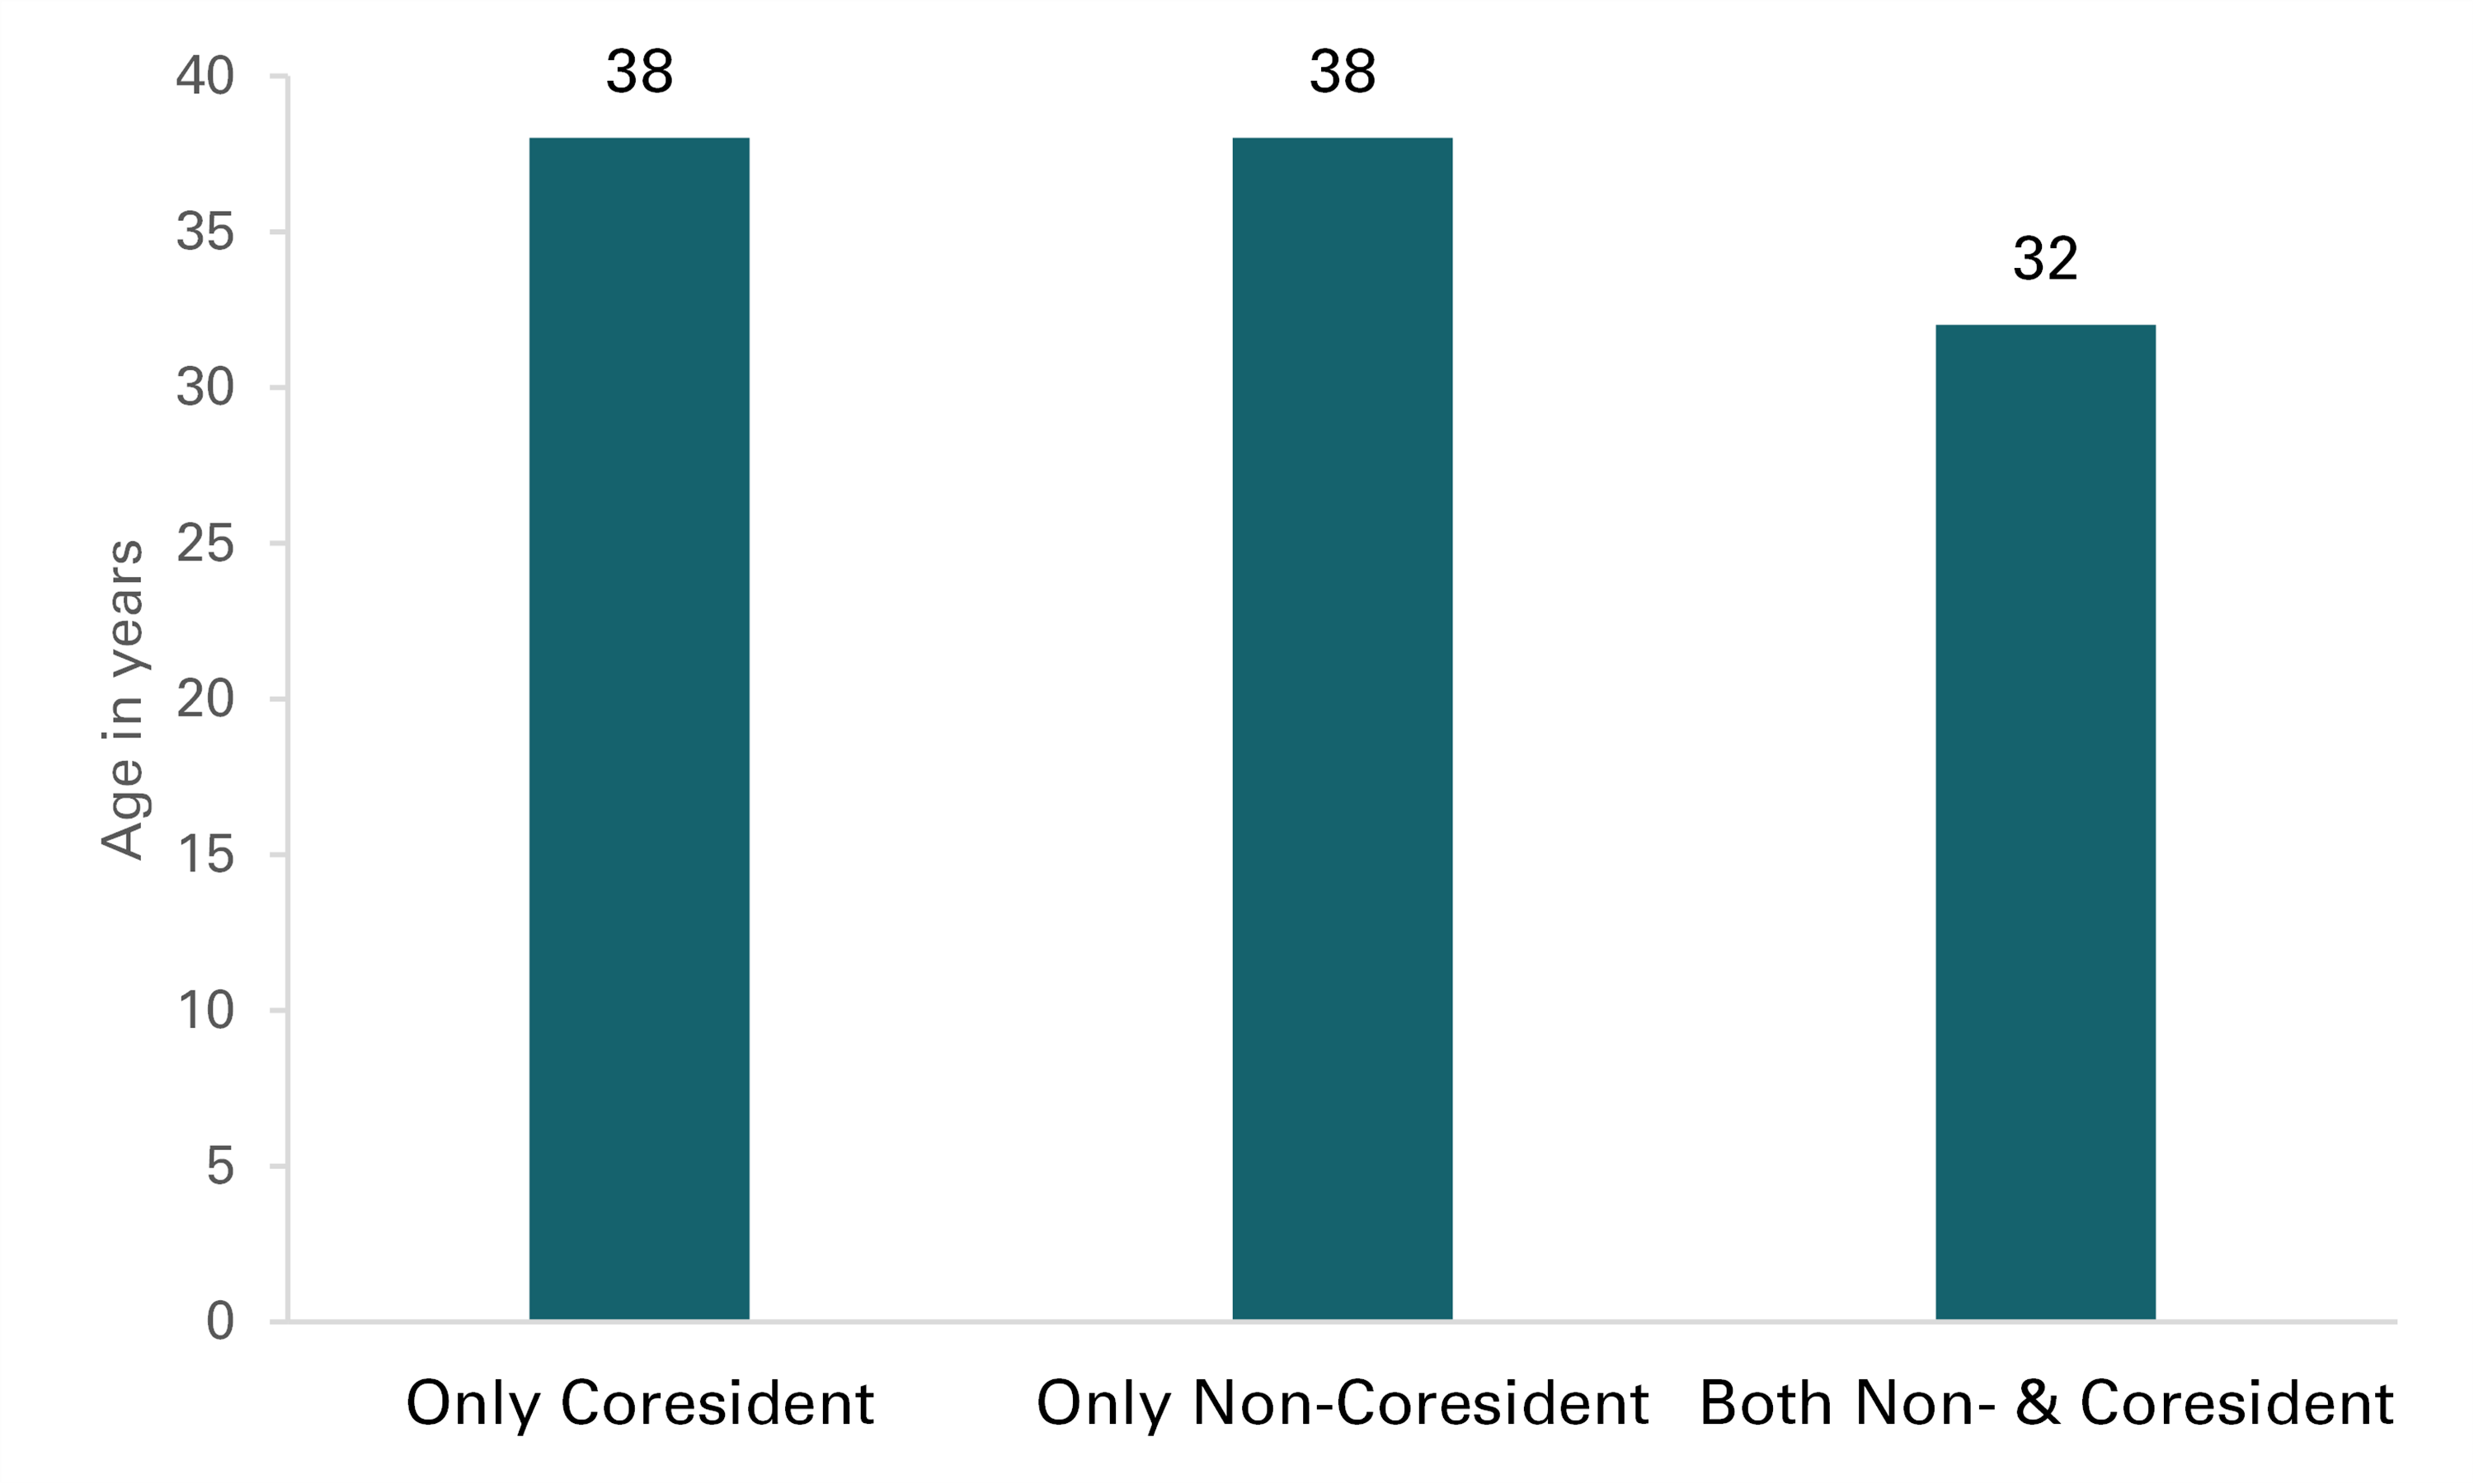
- The median age of fathers with only coresidential children and fathers with only non-coresidential children was 38 years old. Fathers with both non- and coresidential children were six years younger with a median age of 32 years old.
Figure 4. Median Age by Fathers’ Coresidence Status

Data Source:
National Center for Health Statistics (NCHS). National Survey of Family Growth Public-Use Data and Documentation. Hyattsville, MD: CDC National Center for Health Statistics. https://www.cdc.gov/nchs/nsfg/index.htm
References:
Graham, K. (2022). Coresidential fathers with minor children, 2015-2019. Family Profiles, FP-22-22. Bowling Green, OH: National Center for Family & Marriage Research. https://doi.org/10.25035/ncfmr/fp-22-22
Graham, K., Manning, W.D., Payne, K.K., Brown, S.L., Guzzo, K.B., & Wildsmith, E. (2023). Celebrating and supporting fathers’ roles in caring for children. Child Trends. https://doi.org/10.56417/5709z2107s
Suggested Citation:
Graham, K. (2023). Sociodemographic Characteristics of Fathers by Fathers’ Coresidential Status. Family Profiles, FP-23-20. Bowling Green, OH: National Center for Family & Marriage Research. https://doi.org/10.25035/ncfmr/fp-23-20
Updated: 11/07/2025 03:34PM

