
Females Who Gave Birth within the Past 12 Months, 2024
Family Profile No. 16, 2026
Authors: Olivia P. Morrison & Krista K. Westrick-Payne
Provisional data from the NVSS indicate the United States’ general fertility rate (GFR = number of live births per 1,000 females aged 15-44) decreased from 53.8 in 2024 to 53.1 in 2025, a decline of 1% (Hamilton et al., 2026). Alongside changes in fertility rates, the marital context of births has also shifted. Since 2008, the share of births to unmarried females generally declined (Westrick-Payne, 2026). This profile uses the 2024 American Community Survey (ACS) to examine the demographic characteristics (educational attainment, race/ethnicity, and age) of currently married and unmarried females aged 15-50 who gave birth in the past 12 months[1]. This profile is an update of FP-20-17 (Schweizer, 2020) and FP-22-13 (Brown, 2022).
[1] ACS data is collected year-round and female respondents aged 15-50 were asked about births that occurred within 12 months prior to the date of their interview; therefore, the births captured in this profile could have taken place as early as January 2023 and as late as December 2024, depending on the month of the interview. The marital status and birth status reference experiences in the past year rather than specific dates so there could be some imprecision in these estimates.
Females Who Gave Birth in the Past 12 Months by Marital Status, 2024
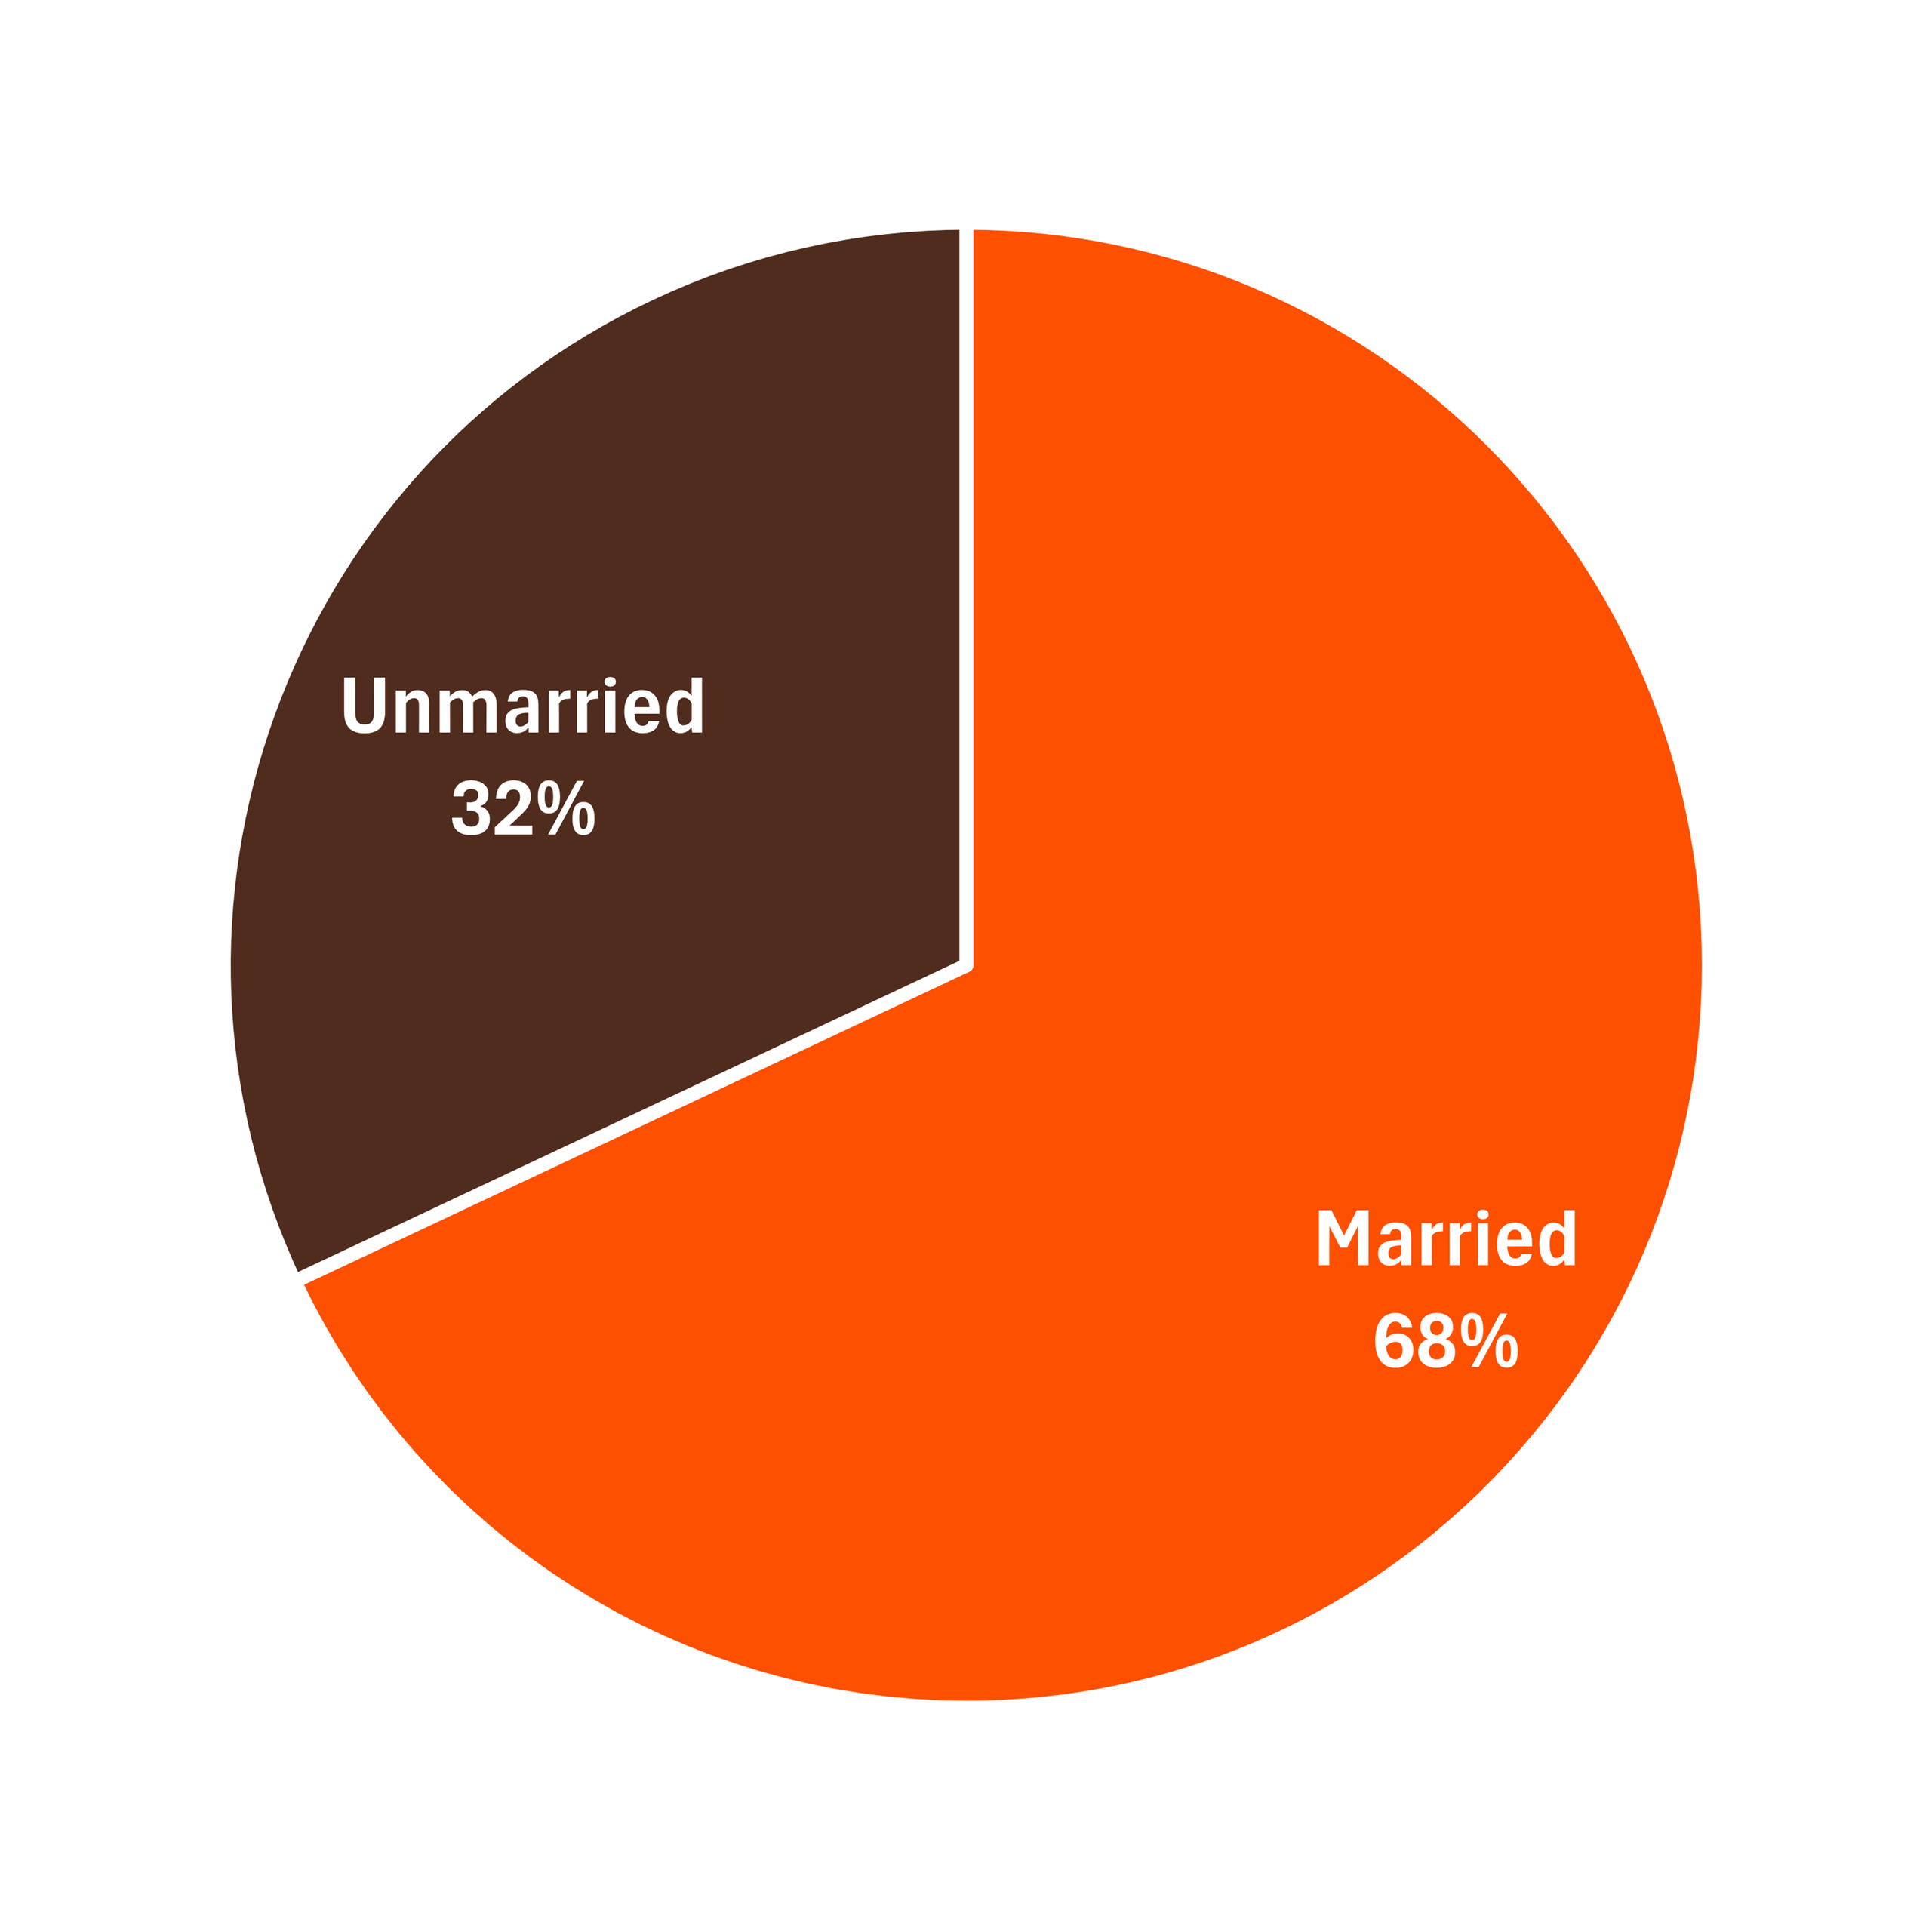
- In 2024 the share of births occurring within marriage remained larger (68%) than the share among unmarried mothers (32%). The share of births among unmarried mothers was lower in 2024 than it was in 2008 (37%) or 2018 (36%) (Schweizer, 2020) but about the same as in 2020 (31%) (Brown, 2022).
- The majority of unmarried females who had a birth in the last year had never been married (83%, not shown).
- Among married females who had a birth in the last year, 93% were in a first marriage and 6% had married in the past 12 months (results not shown).
Figure 1. Marital Status of Females Aged 15-50 Who Gave Birth in the Past 12 Months, 2024
Educational Attainment by Marital Status, 2024
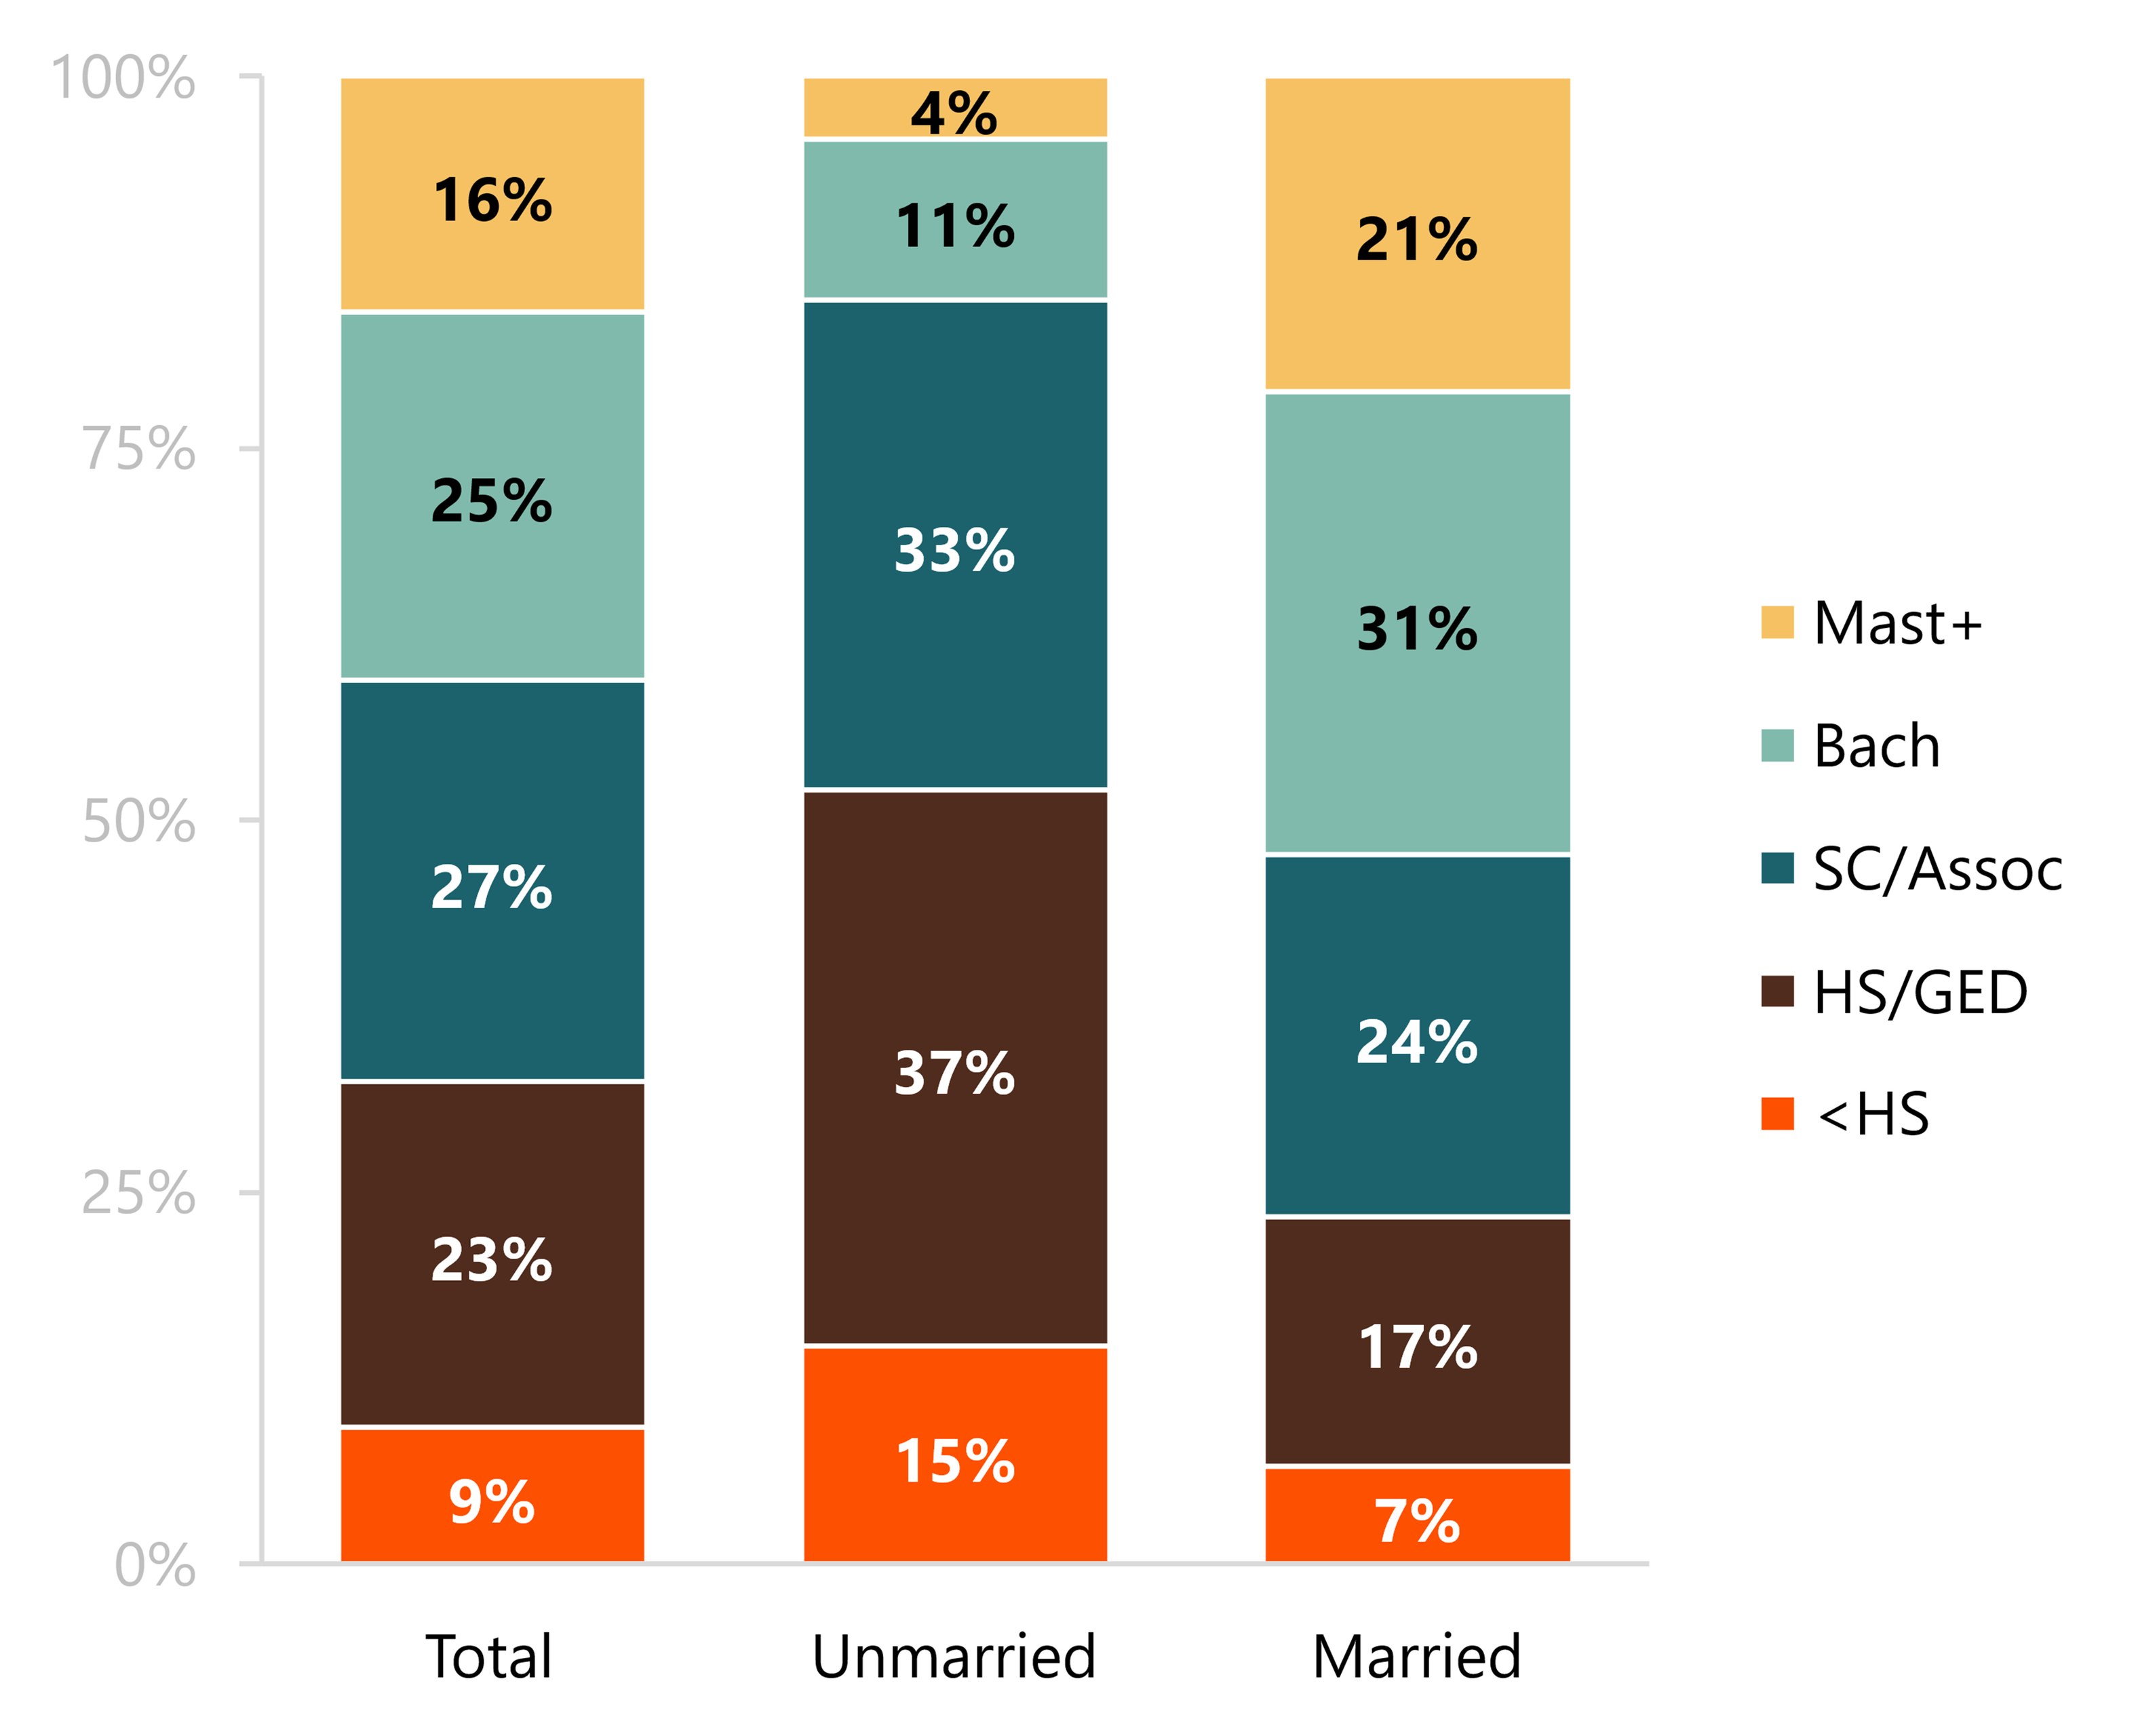
- Among unmarried females who gave birth in the past 12 months, over one-third (37%) had a high school diploma and one-third (33%) had some college or an associate degree, accounting for the majority of unmarried females (70%). Conversely, only 41% of married females fell into these educational attainment groups.
- Among married females who gave birth in the past 12 months, the largest share had a bachelor’s degree (31%), nearly three times the share among their unmarried counterparts (11%). The relative disparity was even larger between those who had a master’s degree or more—21% versus 4%, more than a five-fold difference.
- The smallest share of married or unmarried females who gave birth in the past 12 months was among those who had less than a high school diploma at 7% and 15%, respectively.
Figure 2. Educational Attainment by Marital Status, 2024
Source: NCFMR analysis of American Community Survey, 1-Year Estimates, 2024 (IPUMS USA)
Note. Categories may not sum to 100% due to rounding. HS = high school; SC = some college; Assoc = associate degree; Bach = bachelor’s degree; Mast+ = master’s degree or higher.
Racial and Ethnic Variation by Marital Status, 2024
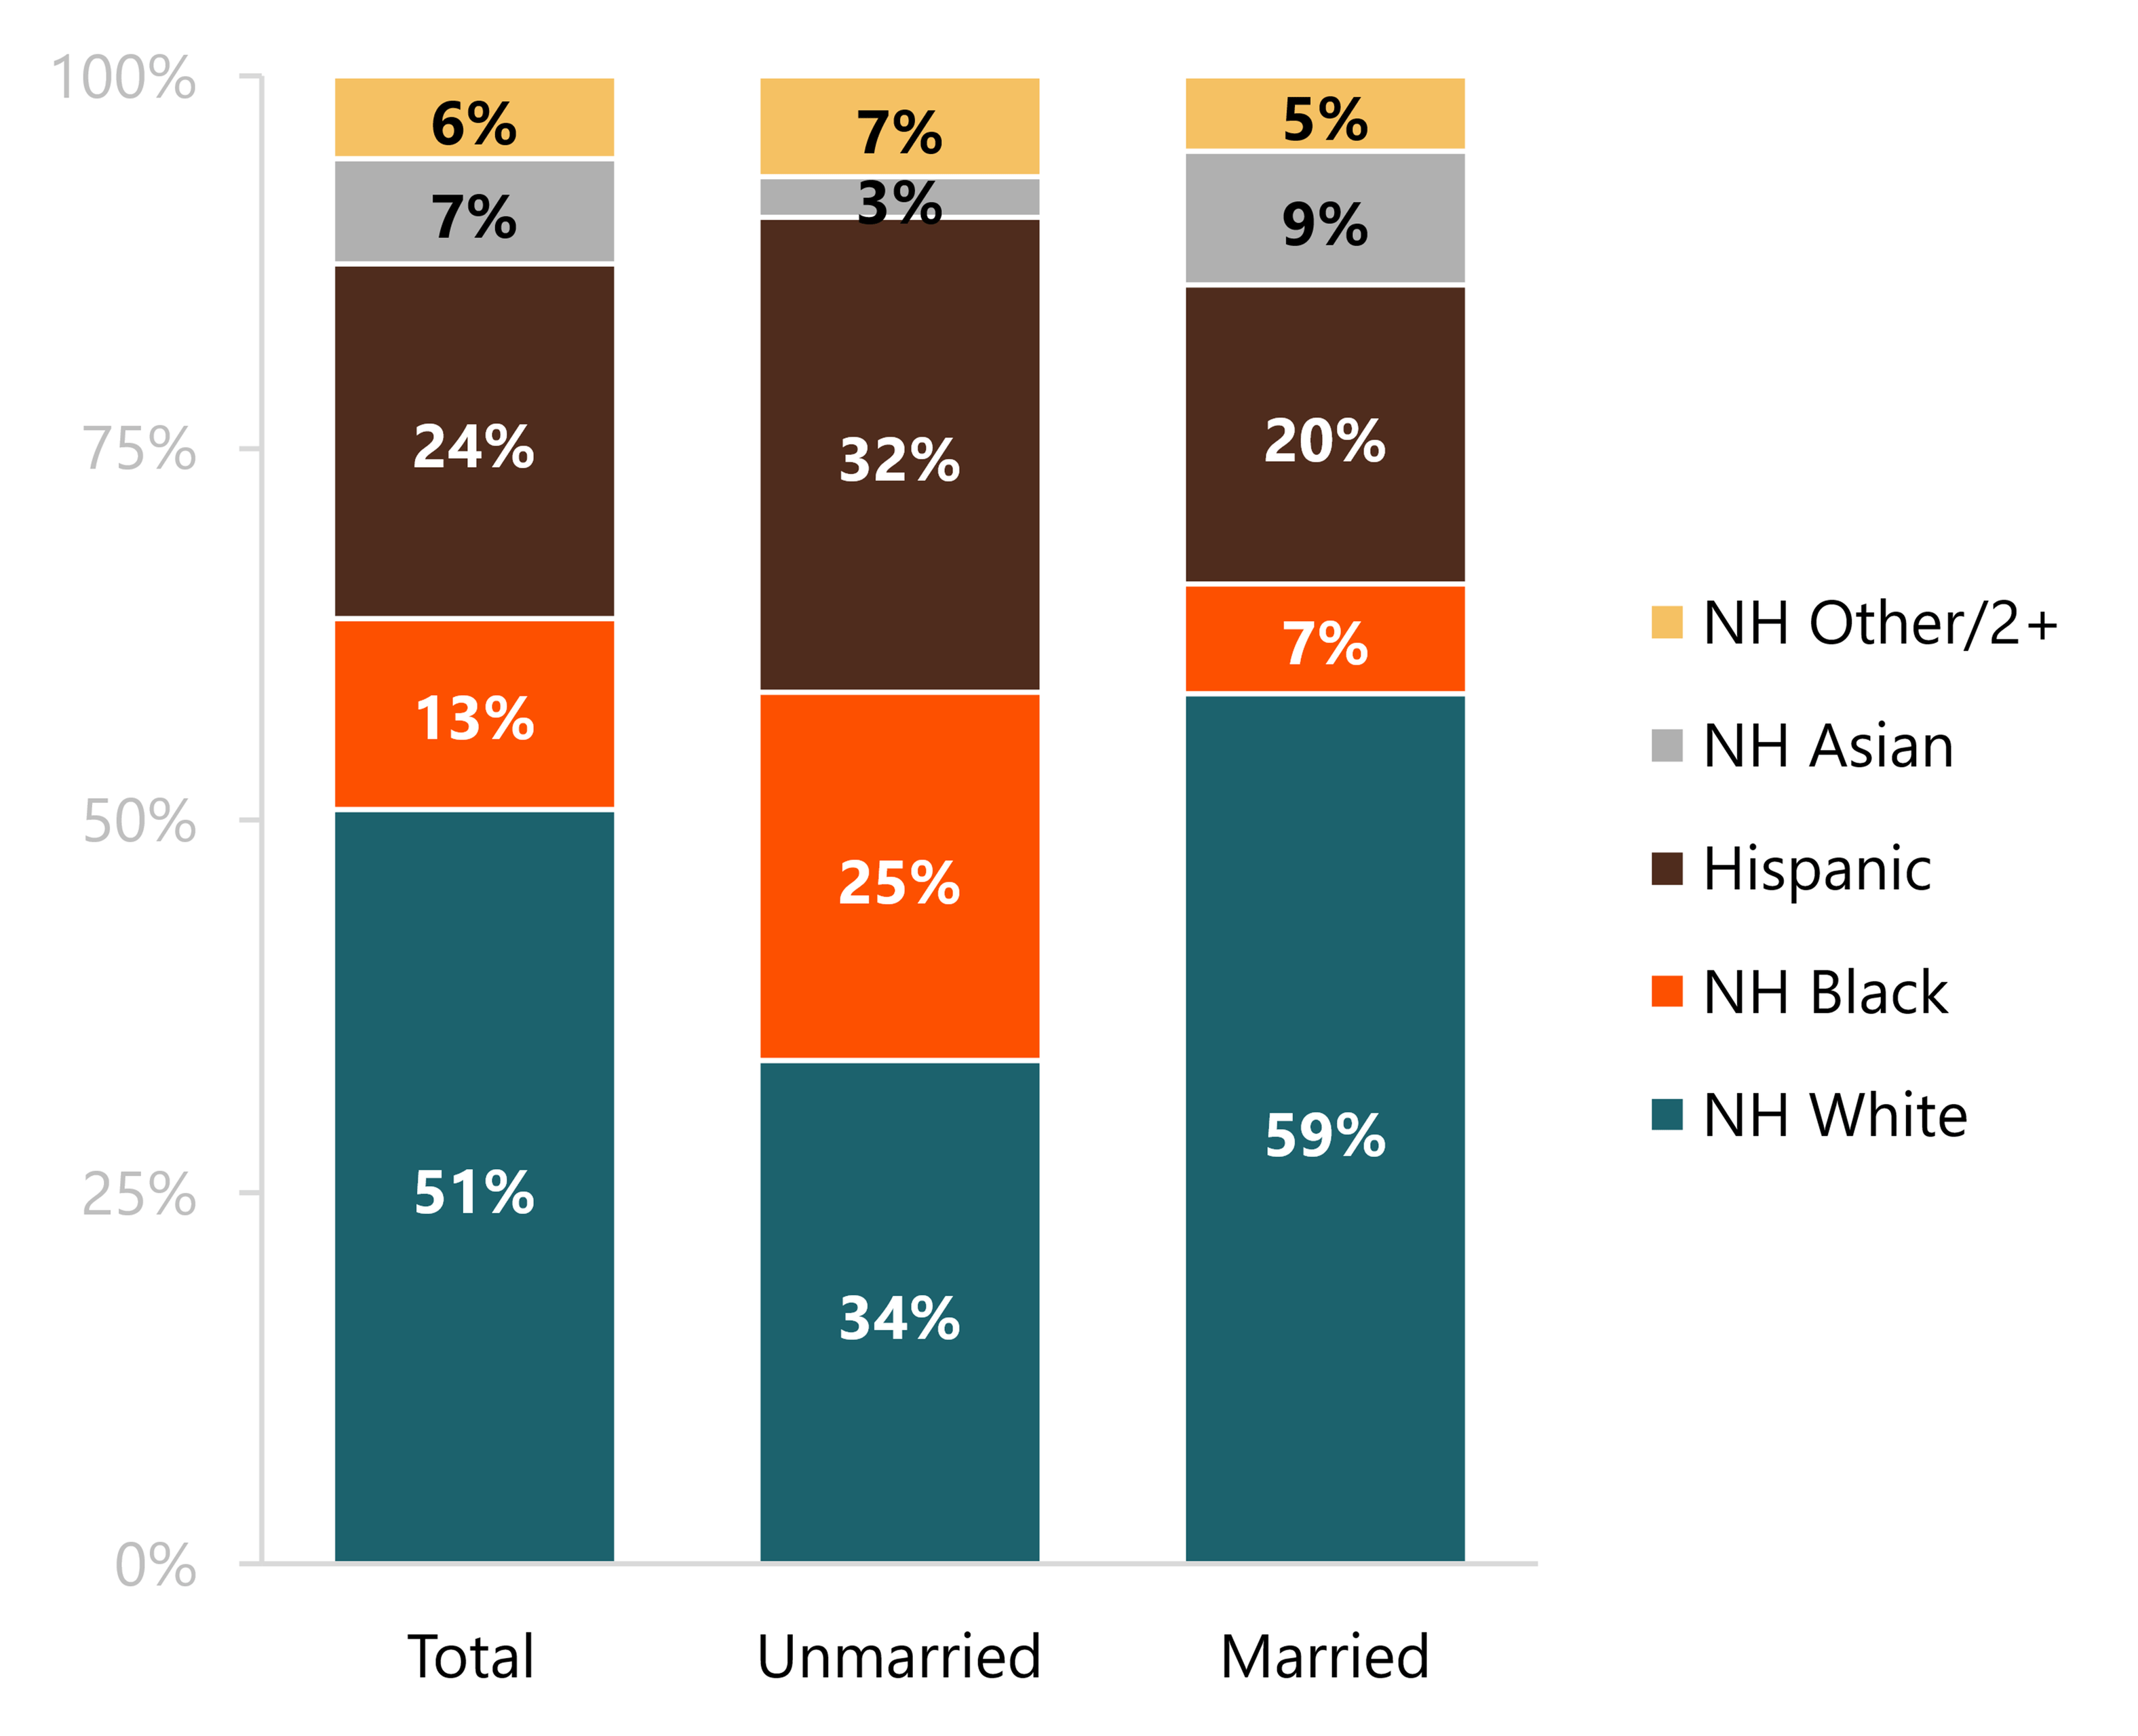
- Among unmarried females who gave birth in the past 12 months, one-third were non-Hispanic white (34%), one-third were Hispanic (32%) and one-fourth were Black (25%). These shares among Hispanic and non-Hispanic Black females were larger than those among married females.
- Among married females aged 15-50 who gave birth in the past 12 months, nearly three-fifths (59%) were non-Hispanic White, with the second-largest share identifying as Hispanic (20%), followed by non-Hispanic Asian females (9%).
Figure 3. Race/Ethnicity by Marital Status, 2024
Source: NCFMR analysis of American Community Survey, 1-Year Estimates, 2024 (IPUMS USA)
Note. Categories may not sum to 100% due to rounding. NH = Non-Hispanic. “NH Asian” includes non-Hispanic individuals identifying as Asian or Native Hawaiian and Other Pacific Islander. “Other/2+ Races” includes non-Hispanic individuals identifying as American Indian or Alaska Native alone, some other race alone, or two or more races.
Age Group by Marital Status, 2024
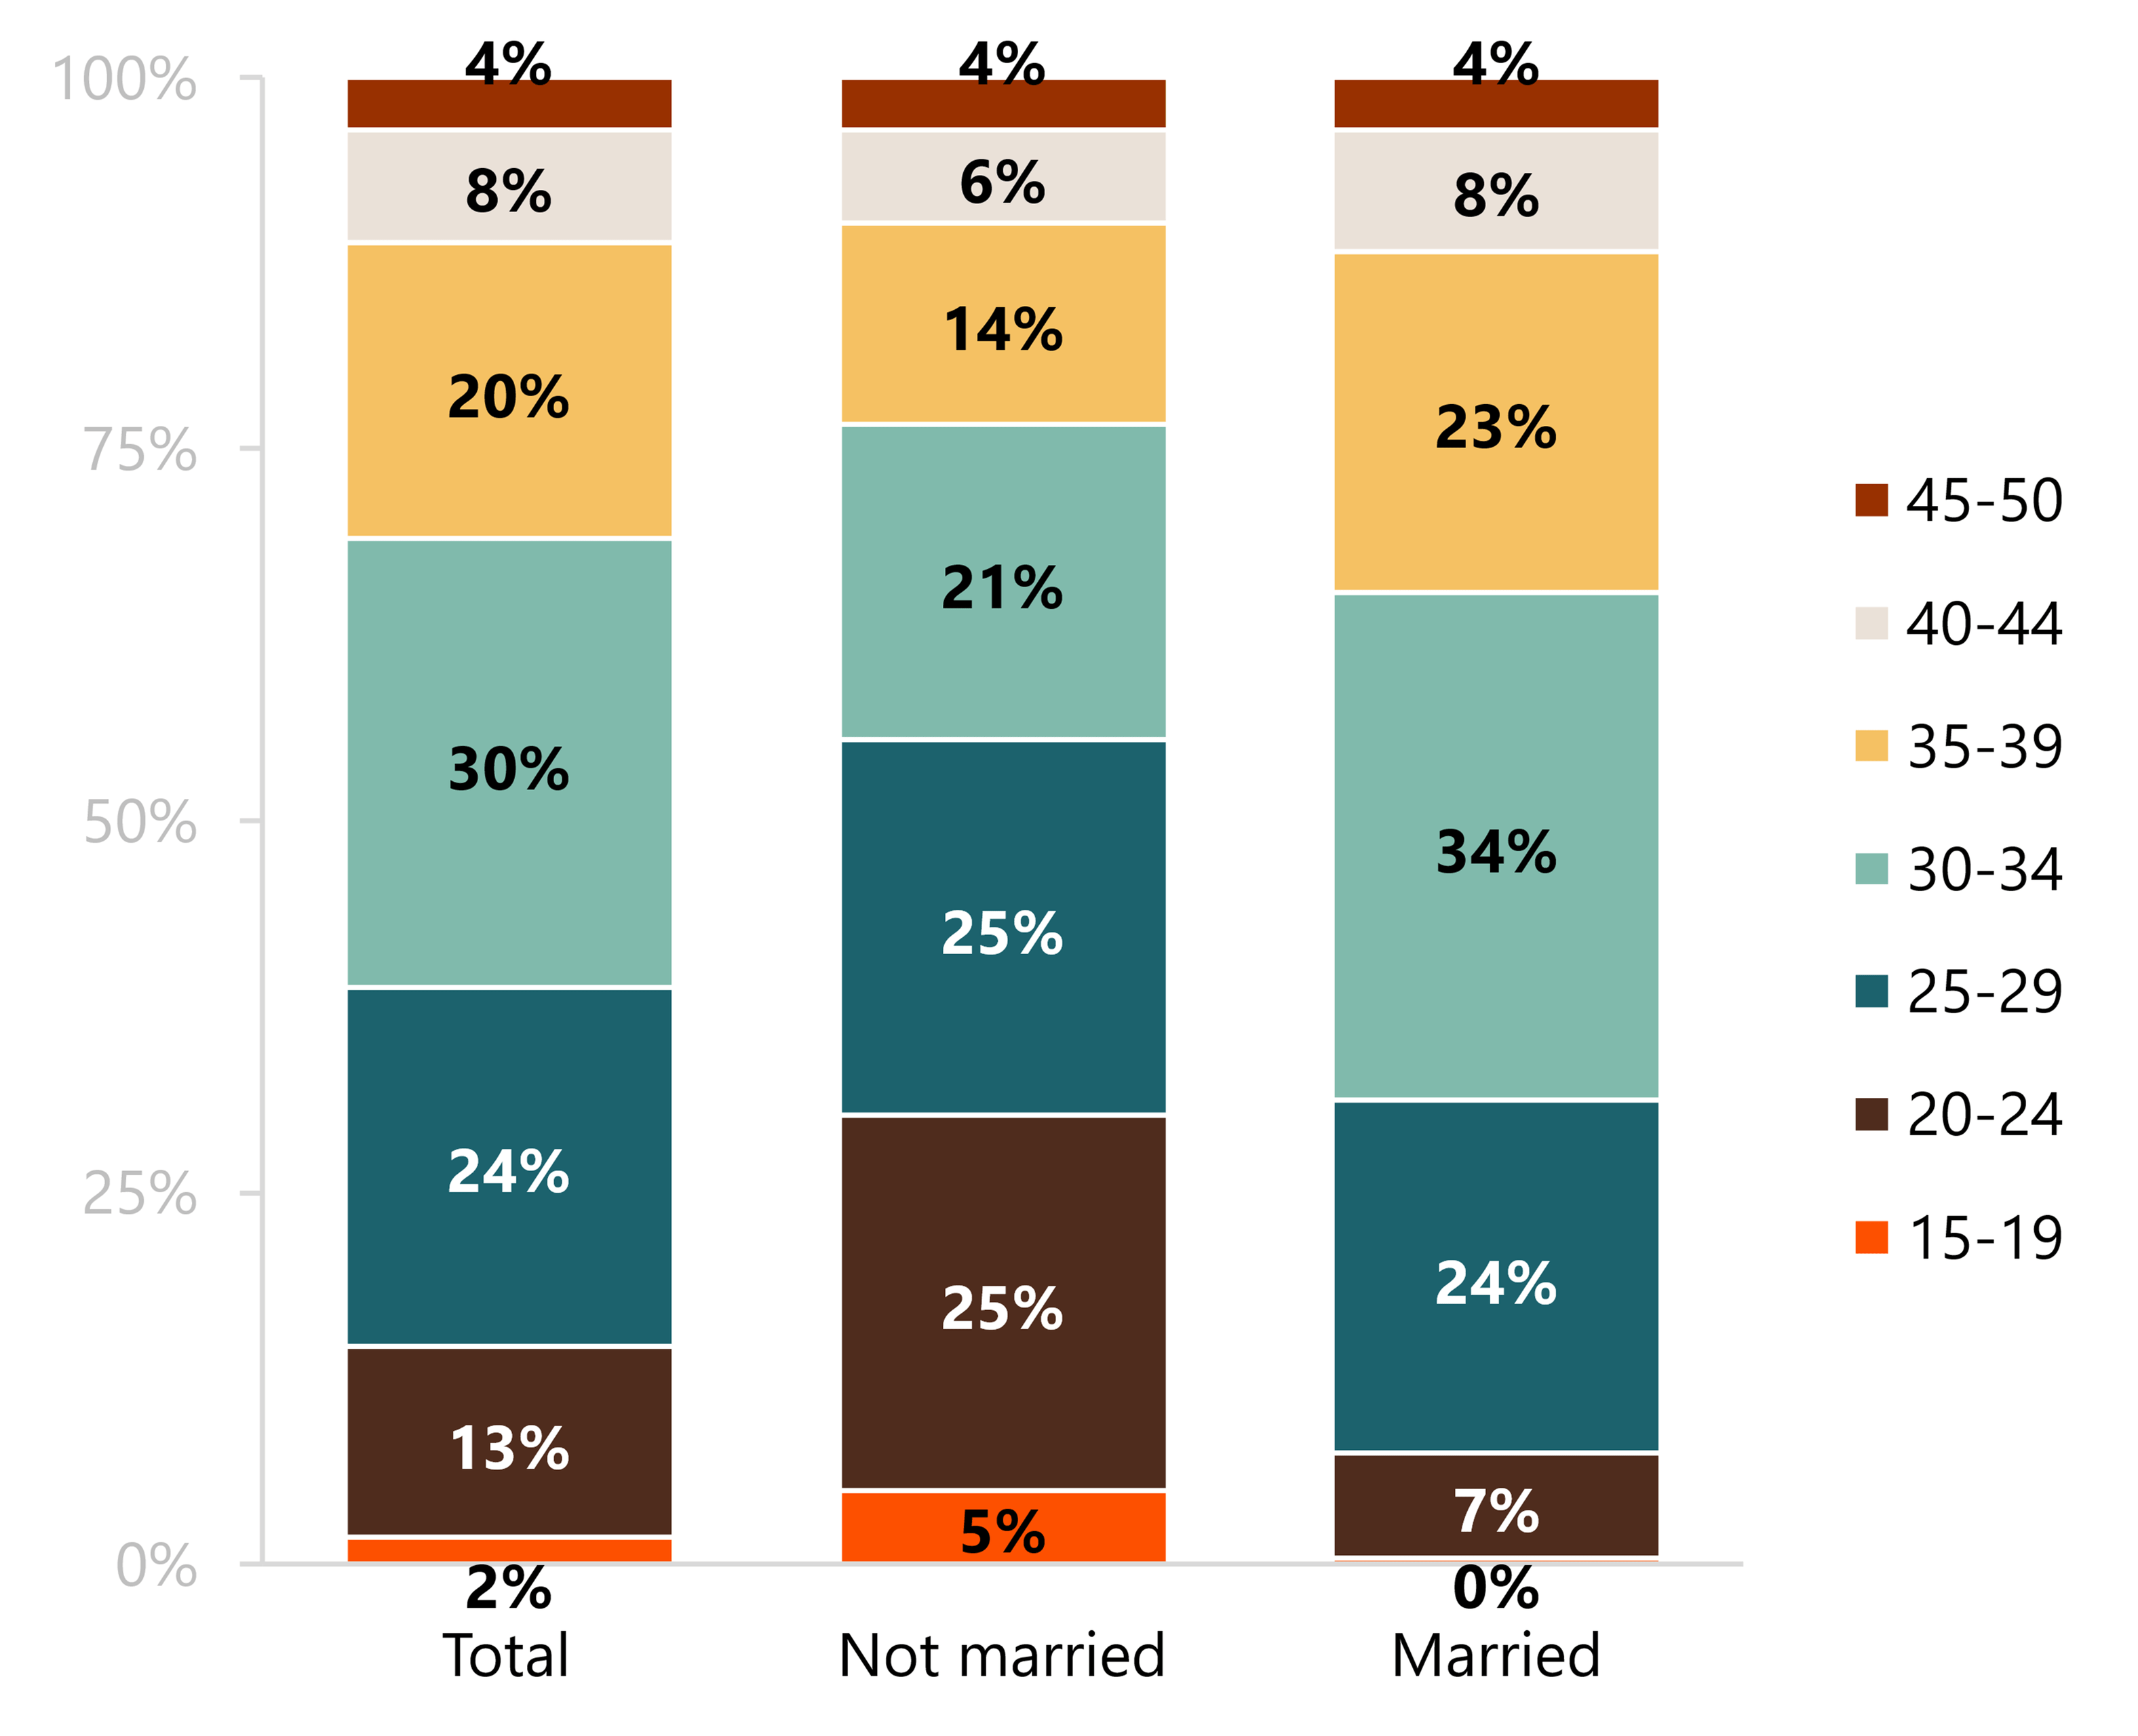
- Unmarried females who gave birth in the past 12 months were younger than their married counterparts. Over half (55%) of unmarried females who gave birth in the past 12 months were under age 30, compared with about one-third (31%) of married females. About one in ten females who gave birth in the past 12 months were unmarried and age 40 or older.
- Among married females who gave birth in the last 12 months, the largest share was aged 30 to 34 (34%), and 23% were aged 35-39. One in eight (12%) married females who gave birth in the past 12 months were aged 40 or older.
Figure 4. Age Group by Marital Status, 2024
Source: NCFMR analysis of American Community Survey, 1-Year Estimates, 2024 (IPUMS USA)
Note. Categories may not sum to 100% due to rounding.
This Family Profile is an update of: FP-22-13 & FP-20-17

Data Source:
Ruggles, S., Flood, S., Sobek, M., Backman, D., Chen, A., Cooper, G., Richards, S., Rodgers, R., & Schouweiler, M. (2023). IPUMS USA: Version 14.0 (14.0) American Community Survey. Minneapolis, MN: IPUMS. https://doi.org/10.18128/D010.V14.0
References:
Brown, A. R. (2022). Women who gave birth within the past 12 months, 2020. Family Profiles, FP-22-13. Bowling Green, OH: National Center for Family & Marriage Research. https://doi.org/10.25035/ncfmr/fp-22-13
Hamilton, B. E., Osterman, M. J. K., & Gregory, E. C. W. (2026, April). Births: Provisional data for 2025. Vital Statistics Rapid Release, 43, 1–7. DOI: https://dx.doi.org/ 10.15620/cdc/174587
Schweizer, V. J. (2020). Women who gave birth within the past 12 months, 2018. Family Profiles, FP-20-17. Bowling Green, OH: National Center for Family & Marriage Research. https://doi.org/10.25035/ncfmr/fp-20-17
Westrick-Payne, K. K. (2026). Trends in the share of women who gave birth within the past 12 months, 2008-2024. Family Profiles, FP-26-17 Bowling Green, OH: National Center for Family & Marriage Research. https://doi.org/10.25035/ncfmr/fp-26-17
Suggested Citation:
Morrison, O. P., & Westrick-Payne, K. K. (2026). Women who gave birth within the past 12 months, 2024. Family Profiles, FP-26-16. Bowling Green, OH: National Center for Family & Marriage Research. https://doi.org/10.25035/ncfmr/fp-26-16
Updated: 10/02/2026 02:21PM