Marriage to Divorce Ratio in the U.S.: Demographic Variation, 2018
Family Profile No. 27, 2019
Author: Valerie Schweizer
Marriage to Divorce Ratio in the U.S.: Demographic Variation, 2018
The marriage to divorce ratio was 2.2 in 2018, meaning there were slightly more than two marriages for every one divorce in the United States (FP-19-24). In this profile, we present the marriage to divorce ratio for women across different demographic characteristics (race-ethnicity, educational attainment, and age) in addition to providing women’s marriage and divorce rates across characteristics. Although the ratios and rates are similar measures, they each provide a unique lens on marriage and divorce in the United States. Thus, we chart both to provide a more nuanced picture of marriage and divorce. The marriage to divorce ratio is calculated by dividing the number of women’s marriages by the number of women’s divorces for a given population in a given year. The marriage and divorce rates are calculated by dividing the number of women who experienced the event (marriage or divorce in the last 12 months) by the number of women who were at risk of the event. For more information on how marriage and divorce rates are calculated, see Charting Marriage & Divorce in the U.S.: The Adjusted Marriage Rate and Charting Marriage & Divorce in the U.S.: The Adjusted Divorce Rate. For more on the marriage and divorce rates for 2018, see Marriage Rate in the U.S.: Geographic Variation, 2018 and Divorce Rate in the U.S.: Geographic Variation, 2018. A marriage to divorce ratio can be over 1.0 even if the divorce rate is higher than the marriage rate because the rates are calculated using those at risk of experiencing the event in the denominator whereas the marriage to divorce ratio is calculated using the events (marriages and divorces) themselves (i.e., the divorce rate is the denominator).
Marriage to Divorce Ratio by Race-Ethnicity
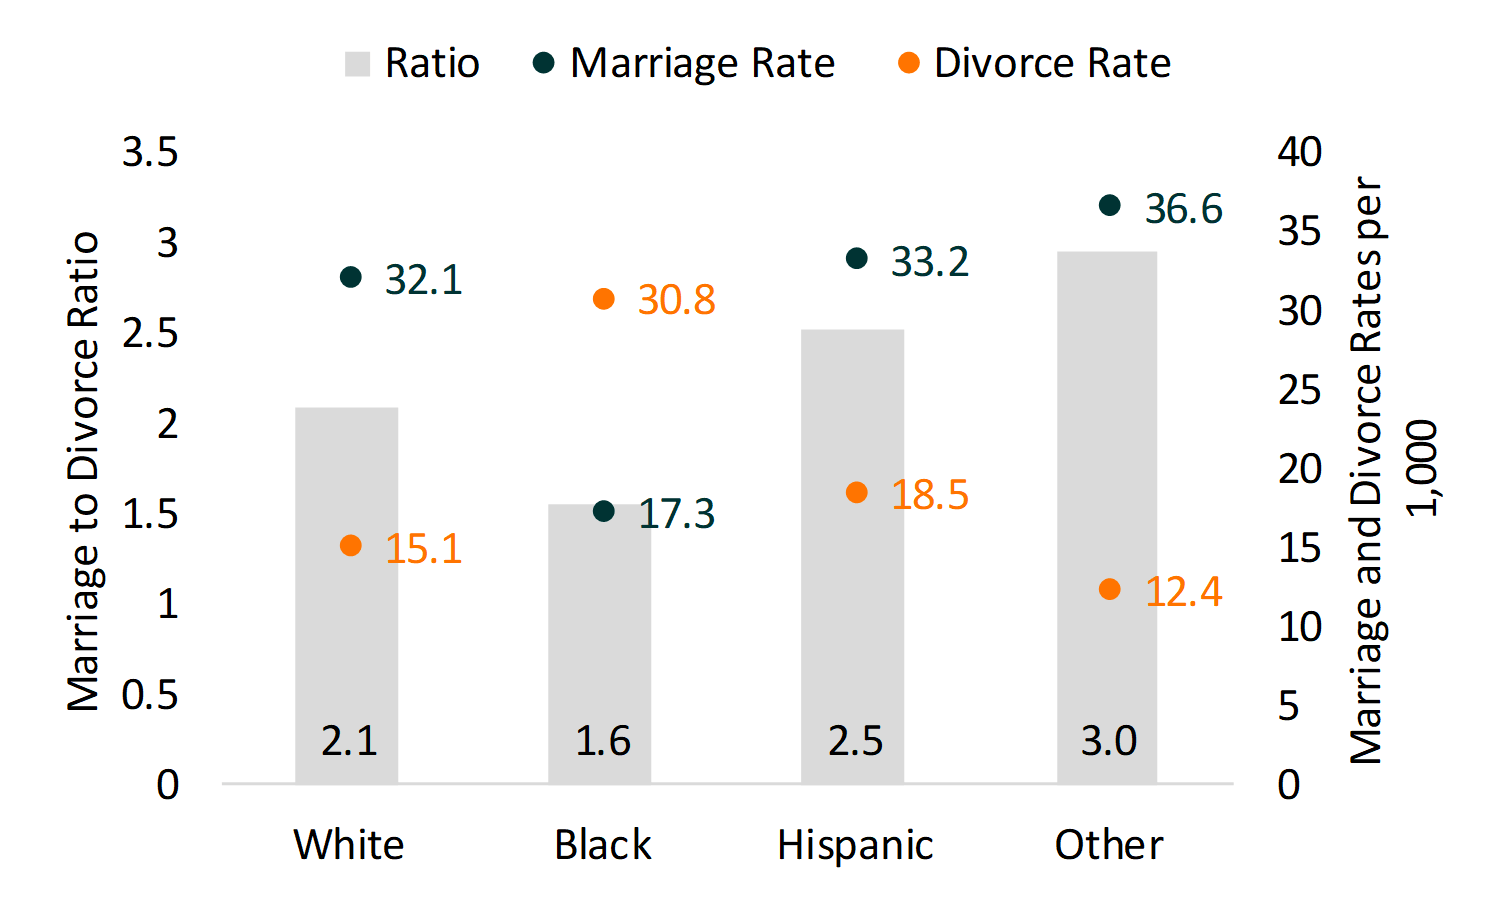
- All racial-ethnic groups had more marriages than divorces. ‘Other’ race women (including Asian, American Indian, Alaska Native, and multiracial women) had the highest marriage to divorce ratio (3.0)—meaning three women married in 2018 for every one woman who divorced. The second highest ratio was found among Hispanic women (2.5) followed by White women (2.1) and Black women (1.6).
- Black women were the only group that had a higher divorce rate than marriage rate, with nearly 31 divorces per 1,000 married women aged 15 and older and only 17.3 marriages per 1,000 unmarried women.
Figure 1. Women’s Marriage to Divorce Ratio and Marriage and Divorce Rate by Race Ethnicity, 2018

Marriage to Divorce Ratio by Educational Attainment
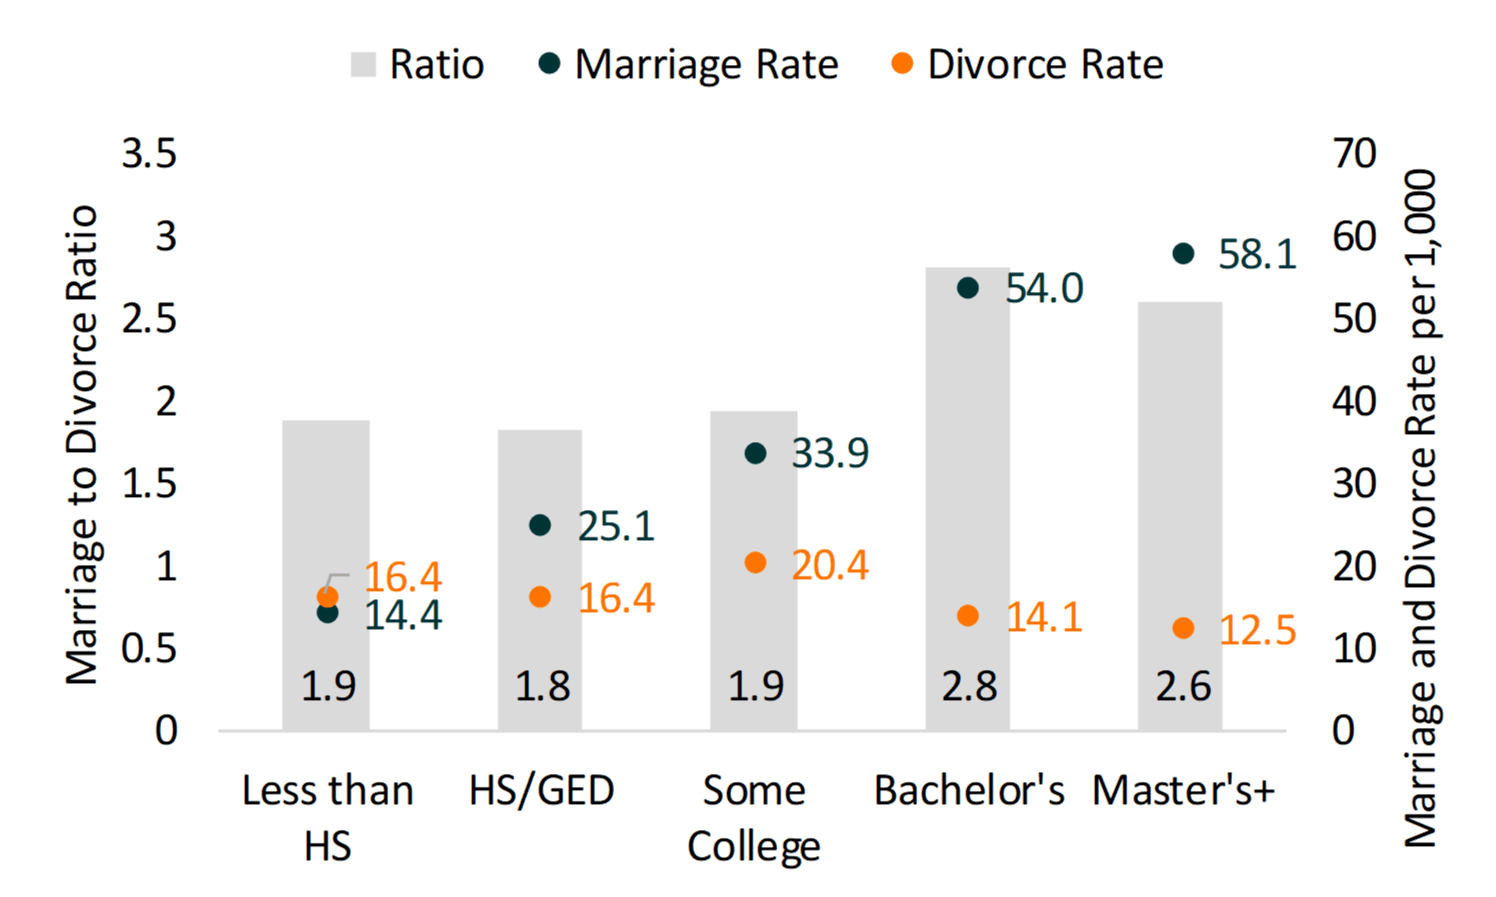
- There are substantial educational differences in marriage and divorce behaviors, with the largest differences between those with a college degree or more relative to those with only some college or less.
- Women with a bachelor’s degree had the highest marriage to divorce ratio at almost three marriages per every one divorce. This is similar for women with a master’s degree or higher (2.6).
- Women with less than a high school degree (1.9), a high school degree or GED (1.8), and some college education (1.9) had comparable marriage to divorce ratios at about two marriages per every one divorce.
- Those with less than a high school degree were the only education category to have a higher divorce rate than marriage rate.
Figure 2. Women’s Marriage to Divorce Ratio and Marriage and Divorce Rate by Educational Attainment, 2018

Marriage to Divorce Ratio by Age Group
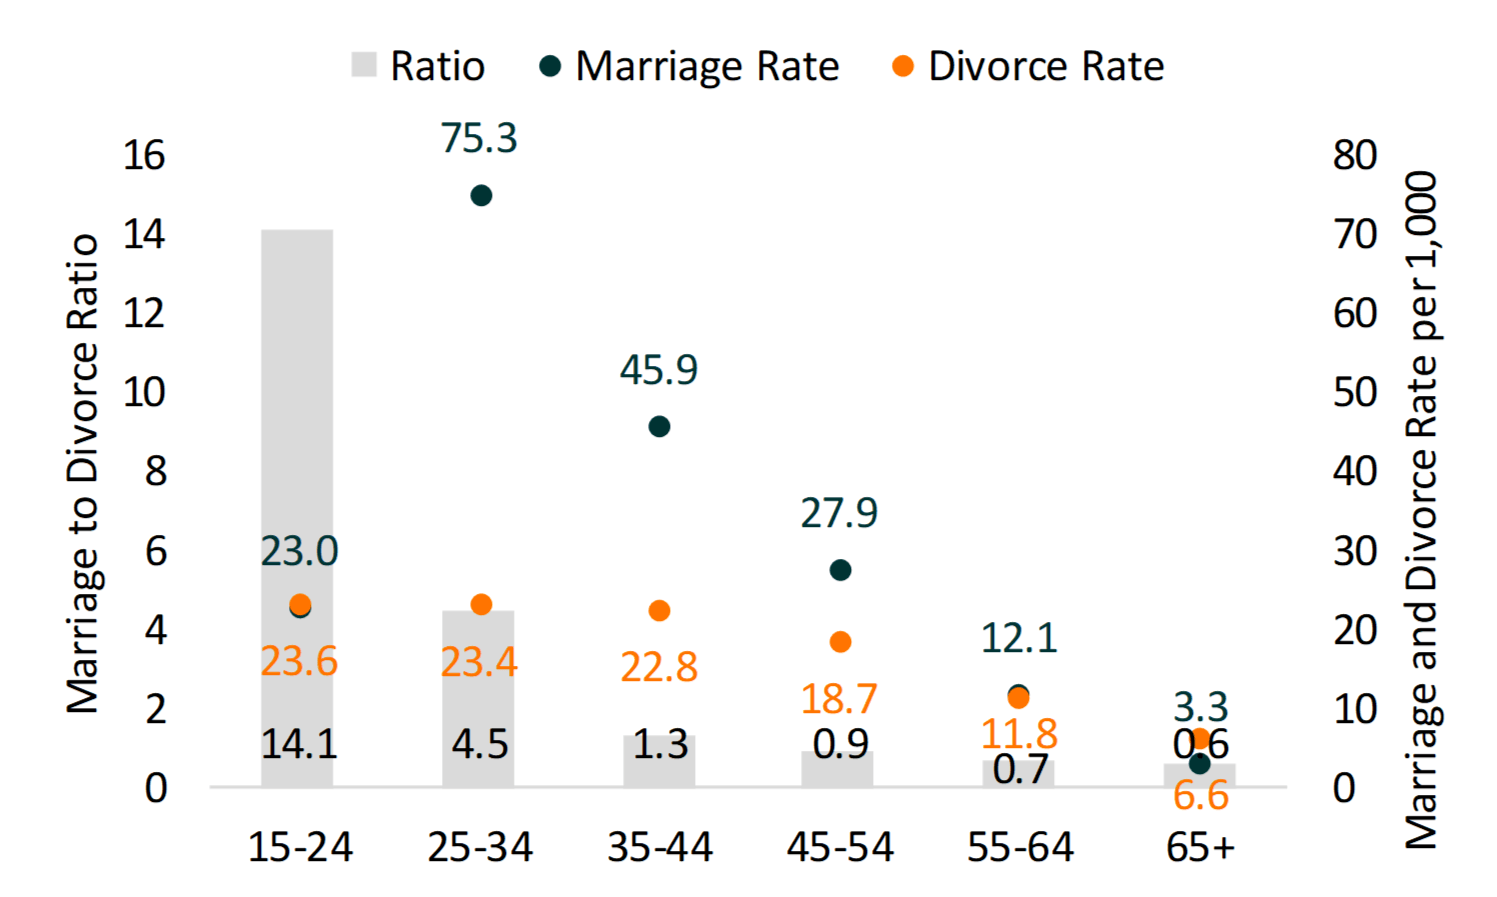
- In 2018, there were about 14 marriages for every one divorce among 15 to 24-year-old women.
- However, the highest marriage rate was among those aged 25 to 34 with 75.3 marriages per 1,000 unmarried women.
- Those aged 45 to 54, 55 to 64, and 65 and older all had more divorces than marriages in 2018.
- Only two age groups had a higher divorce rate than marriage rate: those aged 15 to 24 and those aged 65 and over.
Figure 3. Women’s Marriage to Divorce Ratio and Marriage and Divorce Rate by Age Group, 2018

References
- Allred, C. (2019). Marriage rate in the U.S.: Geographic Variation, 2018. Family Profiles, FP-19-22. Bowling Green, OH. National Center for Family and Marriage Research.
- Allred, C. (2019). Divorce rate in the U.S.: Geographic Variation, 2018. Family Profiles, FP-18-23. Bowling Green, OH. National Center for Family and Marriage Research.
- Payne, K. K. (2018). Charting marriage and divorce in the U.S.: The adjusted marriage rate. Bowling Green, OH. National Center for Family and Marriage Research.
- Payne, K. K. (2018). Charting marriage and divorce in the U.S.: The adjusted divorce rate. Bowling Green, OH. National Center for Family and Marriage Research.
- Schweizer, V. J. (2019). Marriage-to-divorce ratio in the U.S.: Geographic variation, 2018. Family Profiles, FP-19-24. Bowling Green, OH. National Center for Family and Marriage Research.
Suggested Citation
- Schweizer, V. (2019). Marriage to divorce ratio in the U.S.: Demographic variation, 2018. Family Profiles, FP-19-27. Bowling Green, OH: National Center for Family & Marriage Research. https://doi.org/10.25035/ncfmr/fp-19-27.


This project is supported with assistance from Bowling Green State University. From 2007 to 2013, support was also provided by the U.S. Department of Health and Human Services, Office of the Assistant Secretary for Planning and Evaluation. The opinions and conclusions expressed herein are solely those of the author(s) and should not be construed as representing the opinions or policy of any agency of the state or federal government.
Updated: 04/06/2021 01:55PM

