Age at First Birth Among Mothers 40-44, 1990 & 2018
Family Profile No. 06, 2020
Authors: Valerie Schweizer and Karen Benjamin Guzzo
The transition to parenthood is occurring at increasingly older ages in recent decades (FP-18-25; FP-19-16). However, changes in birth timing vary based on sociodemographic characteristics (education, race/ethnicity, and completed family size). In this profile, we use data from the Current Population Survey June Fertility Supplement to estimate the average age at first birth among mothers at the end of their childbearing years (aged 40-44) in 1990 and 2018. We also present the 25th and 75th percentile around the median to show whether the most common age range for first births is shrinking or widening over time. Among mothers aged 40-44, the average age at first birth increased from 23 in 1990 to 26 in 2018. The overall age range also widened from six years in 1990 to nine years in 2018.
Education
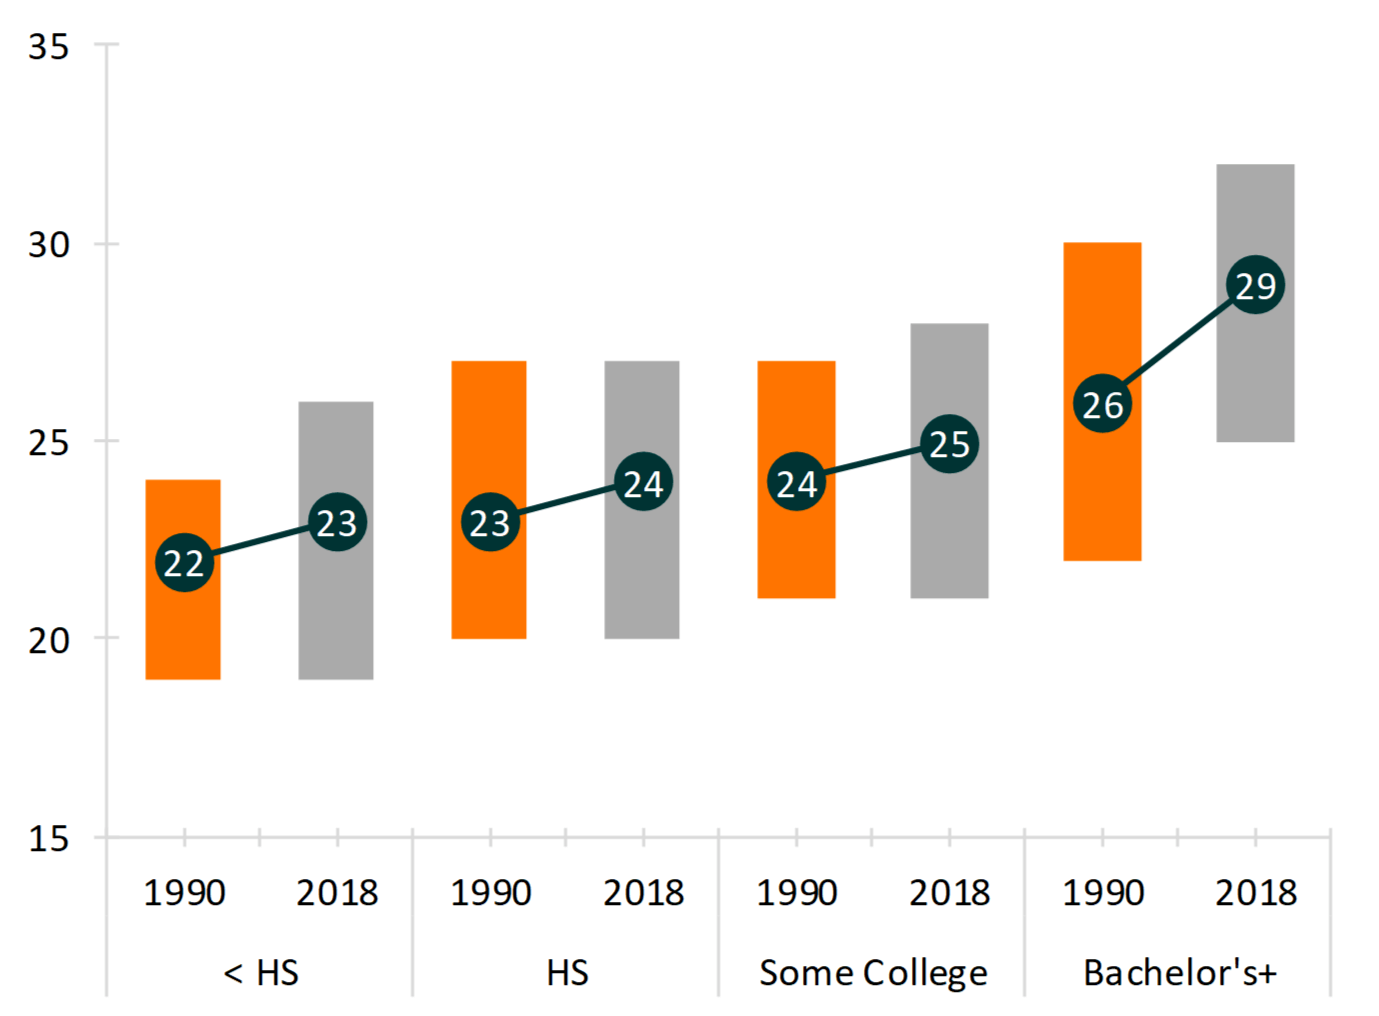
From 1990 to 2018, the mean age at first birth among mothers aged 40-44 increased across all education levels.
- In 1990, 50% of first births among mothers with less than a high school degree occurred between ages 19 and 24, a five-year range. This range increased to seven years by 2018.
- Although the average age at first birth rose among those with a high school degree between 1990 and 2018, the age range when these women had their first birth remained the same, between 20 and 27.
- Among mothers with some college education, the average age increased by one year from 24 to 25.
- Mothers with a bachelor’s degree or higher experienced the largest increase in the average age at first birth over time, increasing by three years from age 26 in 1990 to age 29 in 2018.
- The age range in which half of all births occurred shifted upward more dramatically for mothers in this group compared to women in the other educational attainment groups. However, the age range also shrunk by one year as first births became concentrated in a smaller age range.
Figure 1. Age at First Birth Among Mothers 40-44 by Educational Attainment, 1990 & 2018

Race/Ethnicity
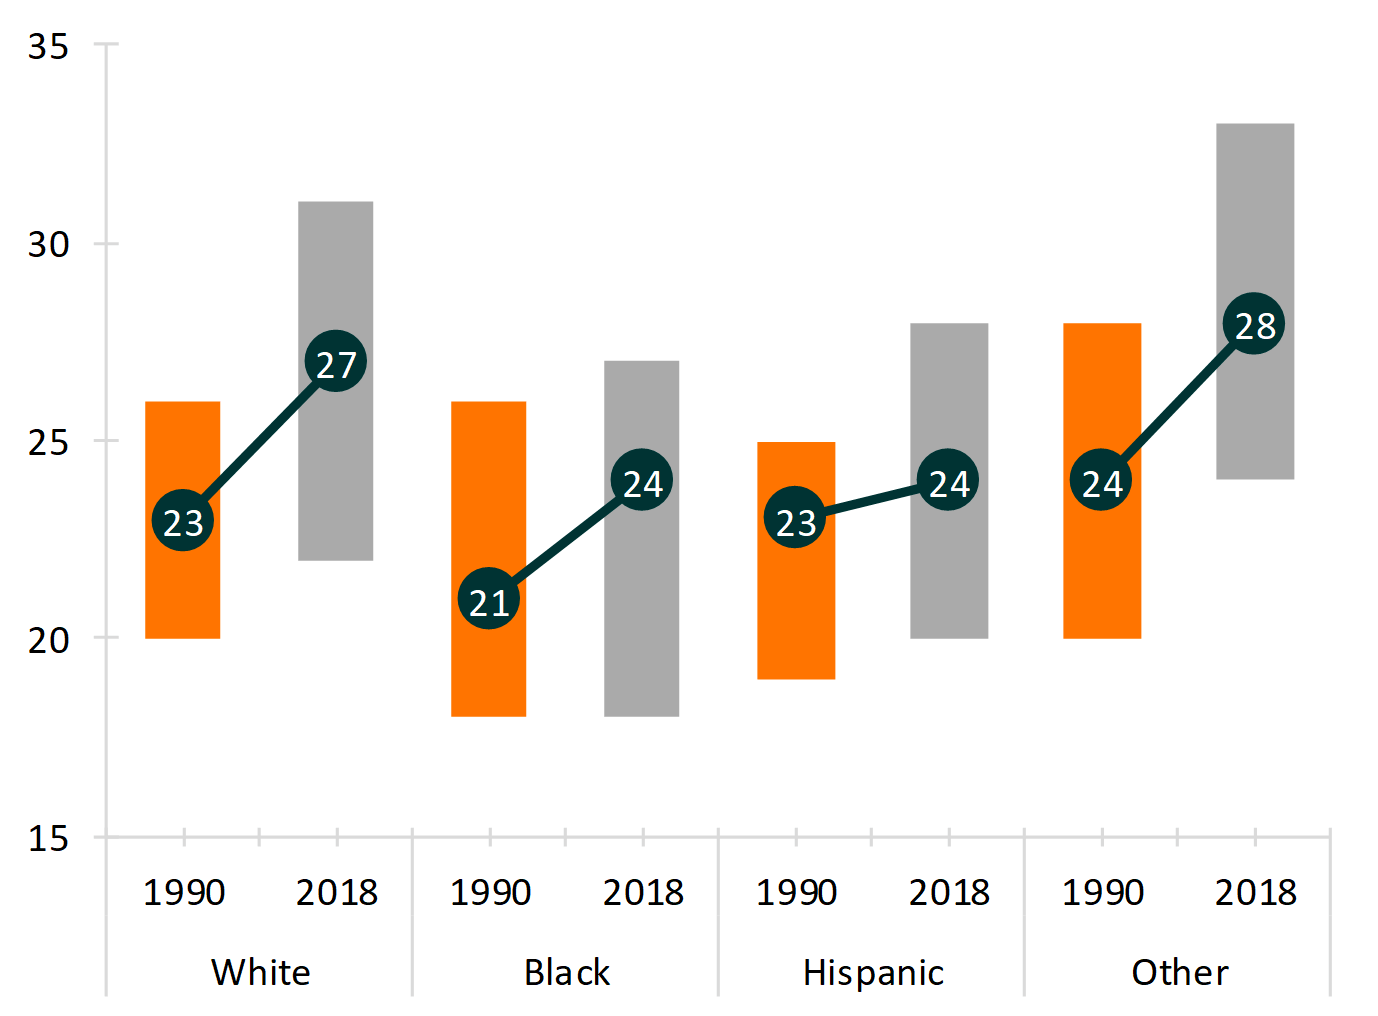
The average age at first birth among mothers aged 40-44 increased for all races from 1990 to 2018.
- White mothers experienced an increase of four years in their average age at first birth from 1990 to 2018 (23 to 27, respectively), with a widening of the most common ages from 6 to 9 years.
- While Black mothers experienced a three-year increase in their average age at first birth, from 21 to 24, there was only a one-year increase in the age range in which 50% of all first births occurred.
- Half of first births among Hispanic mothers in 1990 occurred between 19 and 25. In 2018, this range widened to 20 to 28, although the average age at first birth rose by only one year (from 23 to 24 years old).
- In both 1990 and 2018, other-race mothers had the widest age range in which half of first births occurred (8 and 9 years in 1990 and 2018, respectively).
Figure 2. Age at First Birth Among Mothers 40-44 by Race, 1990 & 2018

Completed Family Size
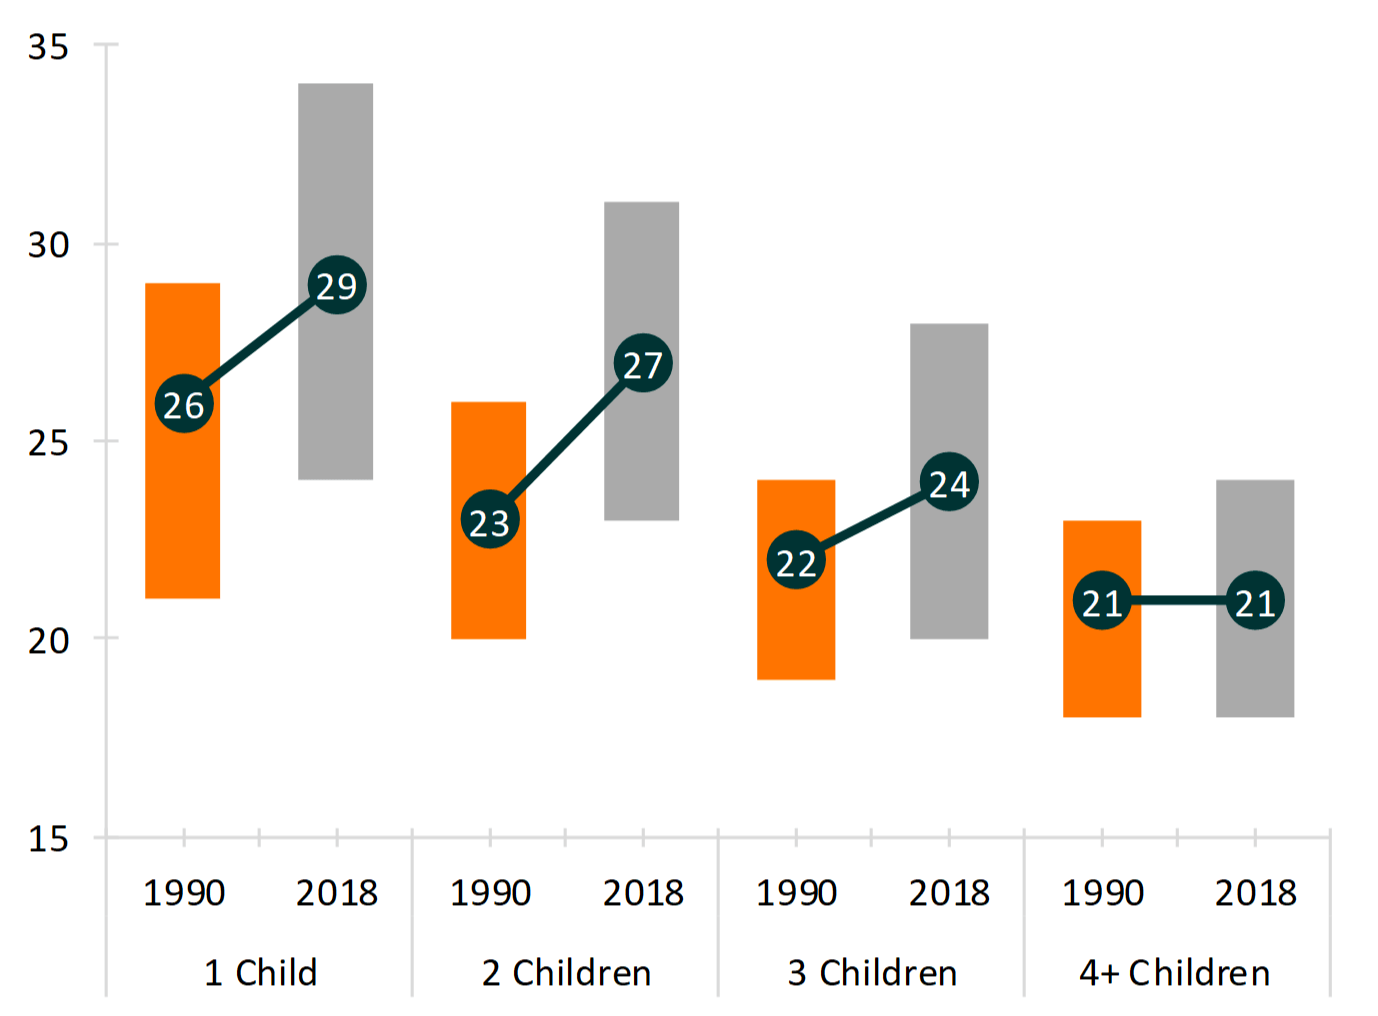
The more children a mother had by her early 40s, the younger she began having children and the larger the age range at which 50% of first births occurred.
- The average age at first birth was consistently highest for those with only one child, and this group had the widest age range in which 50% of all births occurred.
- Those with two children had the largest increase in the average age at first birth from 23 to 27, with the middle-age range increasing from six to eight years.
- The middle-age range at which births occurred widened the most –increasing by three years—among women with three children.
- Those with four or more children experienced no change in their average at first birth. The age range in which half of their first births occurred did widen by one year—from five years to six.
Figure 3. Age at First Birth Among Mothers 40-44 by Parity, 1990 & 2018

Data Sources
- Flood, S., King, M., Rodgers, R., Ruggles, S., & Warren, J. R. (2019). Integrated Public Use Microdata Series, Current Population Survey: Version 7.0 [dataset]. Minneapolis, MN: IPUMS. https://doi.org/10.18128/D030.V7.0
References
- Guzzo, K. B. & Payne, K. K. (2018). Average age at first birth, 1970 - 2017. Family Profiles, FP-18-25. Bowling Green, OH: National Center for Family & Marriage Research. https://doi.org/10.25035/ncfmr/fp-18-25
- Hemez, P. (2019). Family formation experiences: Women’s median ages at first marriage and first birth, 1979 & 2016. Family Profiles, FP-19-16. Bowling Green, OH: National Center for Family & Marriage Research. https://doi.org/10.25035/ncfmr/fp-19-16
Suggested Citation
- Schweizer, V. & Guzzo, K. B. (2020). Age at first birth among mothers 40-44, 1990 & 2018. Family Profiles, FP-20-06. Bowling Green, OH: National Center for Family & Marriage Research. https://doi.org/10.25035/ncfmr/fp-20-06
This project is supported with assistance from Bowling Green State University. From 2007 to 2013, support was also provided by the U.S. Department of Health and Human Services, Office of the Assistant Secretary for Planning and Evaluation. The opinions and conclusions expressed herein are solely those of the author(s) and should not be construed as representing the opinions or policy of any agency of the state or federal government.
Updated: 04/06/2021 02:09PM


